The US Geological Survey (USGS) has released new models and interactive mappers for the SPARROW tool for watershed managers. SPARROW (SPAtially Referenced Regression On Watershed attributes) models estimate the amount of a contaminant transported from inland watersheds to larger water bodies by linking monitoring data with information on watershed characteristics and contaminant sources. Interactive, online SPARROW mapping tools allow for easy access to explore relations between human activities, natural processes, and contaminant transport.
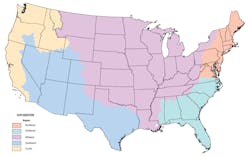
New online SPARROW models and interactive mappers for the Southwest, Pacific, Southeast, Midwest, and Northeast regions of the US are now available. The watershed models estimate streamflow along with yields of total nitrogen, total phosphorus, and suspended sediment in monitored and unmonitored stream reaches across the country. This information can help land and resource managers prioritize water-quality improvement efforts, ensuring adequate supply for human needs and ecological integrity for fish and other aquatic life.
The five regional models describe nutrient- and sediment loading and sources of those loads at a resolution of about 2 square kilometers, which is much finer than that of earlier models, which were about 132 square kilometers. This allows for improved identification of the sources of nutrients and sediment.
The “base year” for the new model predictions has been updated from 2002 to 2012, meaning the models estimate the mean load that would have occurred in 2012 under average annual flow conditions.
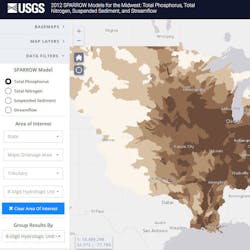
Interactive online mappers allow users to explore river flow and nutrient and sediment loads and yields, and the importance of different sources of water, nutrients, and sediment in a specific river basin. Data can be visualized using maps and interactive graphs and tables, and rankings of loads and yields can be shown by state/province, Hydrologic Unit Code (HUC), and basin. Modeling results can be exported as an Excel spreadsheet or a geospatial dataset. Related USGS reports document the models described in the online mappers.
The models provide an improved understanding of where on the landscape and from what sources (e.g., rainfall, snowmelt, diversions, springs, and wastewater treatment plant effluent) water, nutrients, and sediment in streams and lakes originate. Additionally, the models allow investigation of region-specific issues such as the effects of irrigation in the Southwest and the Pacific; the effects of cover-cropping in the Southeast; identification of nutrient sources in the Midwest; and nutrient and sediment contributions from densely populated areas in the Northeast.
More information about SPARROW and to review the regional reports for the Southwest, Pacific, Southeast, Midwest, and Northeast can be found online.
Source: USGS
