As stormwater modeling software improves, stormwater professionals are discovering the ability to obtain more accurate information for typical projects as well as an increasing number of ways in which it can be used.
What Happens in Houston
An analysis of flood claims in several southeast Houston, TX, suburbs from 1999 to 2009 found that the Federal Emergency Management Agency (FEMA) 100-year floodplain maps failed to capture 75% of flood damages from five serious floods, none of which reached the threshold of a 100-year event, according to researchers at Rice University.
Vieux & Associates’ Vflo and RainVieux software were used in a study of FEMA flood maps and flood claims in a decade-long study of the suburbs.
A team led by Philip Bedient, a professor of engineering in Rice University’s Department of Civil and Environmental Engineering, explored the differences between flood insurance mapping, model outputs, and what really happens, notes Vieux & Associates CEO Jean Vieux.
Vflo is a gridded hydrologic model designed to simulate stormwater runoff based on geospatial data to model interior locations in the drainage network. It is used to simulate runoff from major river basins to small catchments. The same modeling framework is used to develop detailed drainage infrastructure design or for real-time forecasting of rainfall runoff and flooding.
When running Vflo, the RainVieux interface allows the query, display, and download of simulated and observed hydrologic stage/discharge on an interactive web page with near-real-time products and end-of-month archival quality data.
RainVieux is designed to provide quality-controlled rainfall data for municipal, private, and regional organizations’ basin-specific applications including watershed management, infiltration and inflow analysis, long-term capacity planning, and flood event analysis.
The research, conducted by hydrologists and land-use experts at Rice University and Texas A&M University at Galveston and funded by the National Science Foundation, was published in the journal Natural Hazards Review days before Hurricane Harvey inundated the Houston region and caused some of the most catastrophic flooding in US history.
Antonia Sebastian, a research associate with Rice’s Severe Storm Prediction, Education, and Evacuation from Disasters (SSPEED) Center, a post-doctoral researcher at Delft University of Technology in the Netherlands, and co-author of the study, notes that the study’s biggest message is that many losses occur in areas outside FEMA’s 100-year floodplain.
“What we’ve tried to show, both with this study and several others, is that it is possible to do better,” notes lead author Russell Blessing, a Texas A&M—Galveston graduate student with joint appointments at the SSPEED Center and Texas A&M-Galveston’s Center for Texas Beaches and Shores. “There are innovative computational and hydrological tools available to build more predictive maps.”
In the new study, Blessing, Sebastian, and co-author Sam Brody, a professor of marine sciences at Texas A&M-Galveston, director of the Center for Texas Beaches and Shores, and a SSPEED Center investigator, examined the Armand Bayou watershed in southeast Harris County.
Five major rain events occurred in the study area between 1999 and 2009: Hurricane Ike (2008), Tropical Storms Erin (2007) and Allison (2001), and two rainstorms that caused flooding in 2006 and 2009.
Hydrologists often characterize rain events and flooding events with a statistic known as the return interval, with a 100-year flood having a 100-year return interval—but that does not mean such a storm is expected to occur only every 100 years, Blessing points out. Instead, it means there is a 1-in-100 chance—or a 1% chance—that the event will occur in any given year.
Brody has noted that one problem with FEMA’s 100-year floodplain maps is the assumption that flooding will take place only in one dimension—that is, either downstream or upstream, but not perpendicular to the channel.
“That assumption doesn’t hold when you’re in really low-lying areas like Armand Bayou or other coastal watersheds that are very flat,” he says. “When flooding rain accumulates in these areas, it can flow in just about any direction depending upon how high it gets.”
A lack of granularity is another issue with FEMA’s maps, according to the study.
According to Brody and Blessing, the type of soil and the way land is used has significant impacts on flooding, and FEMA’s models often use a single classification for entire neighborhoods or groups of neighborhoods, missing out on small-scale features that can significantly affect flooding.
Sebastian says focusing on 100-year events also is problematic because short, intense rainfall events that don’t meet the 100-year threshold can still cause serious flooding.
“In Armand Bayou, a 100-year rainfall event is one that drops 13.5 inches of rain in a 24-hour period,” she says. “In reality, we also experience much more intense rainfalls in less time. For example, when it rains six inches in two or three hours, it can also cause serious flooding.”
In several other studies, including those that examined flooding in the Clear Creek watershed, Blessing, Brody, Sebastian, and SSPEED colleagues have shown that other approaches such as distributed hydrologic modeling and probabilistic floodplain mapping can be far more predictive of flood damages and flood risk, according to Rice University.
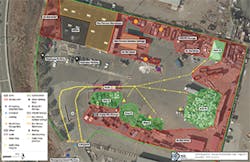
Sims Hayward site visitor orientation map
Adopt-A-Channel
Esri Story Maps is a driving factor behind the success of an Adopt-A-Channel program in Orange County, CA. Built into ArcGIS, Esri Story Maps are web applications designed for end-users to convey information involving maps, places, locations, or geography by combining the maps with narrative text, images, and multimedia, including video.
For years, Orange County has spearheaded ocean cleanup events and extended them into inner coastal cleanup days.
“We began to get people engaged in helping to clean up the channels,” notes Chris Crompton, manager of the Water Quality Compliance Division for the Orange County Public Works Department. He also manages the county’s Adopt-A-Channel program.
That interest led to area residents and businesses in taking an increased stewardship role for creeks and flood control channels within Orange County, he notes. Disneyland, located in Orange County, led the pilot program effort in 2012. The company expressed interest in adopting a section of channel downstream of the Disneyland Resort.
“We began to work with Disneyland on a way that an entity could actually adopt a section of channel,” says Crompton. The company adopted a section that was a little more than a mile long and then extended it onward.
The county worked on issues related to the liability of people entering flood district property to conduct cleanups, including removal of graffiti, trash, and debris.
“We ended up having to develop an entire program on this and get approval from our board of supervisors,” says Crompton.
Following the pilot program success, the county subsequently rolled it out to allow other entities to adopt channel sections. Three years after the program began, the Story Maps were incorporated into it as a tool to better communicate with potential adopters, says Crompton. Most of the mapping work has been done with summer interns working with GIS staff, he says.
The program is modeled after Adopt-A-Highway programs in that it incorporates two models. In one, a corporation is entitled to puts its name on a sign and hires somebody to conduct the cleanup. Most corporations in Orange County use the Orange County Conservation Corps to do the work, says Crompton. The Conservation Corps offers at-risk youth opportunities for life experiences that will help them move forward, he adds.
For example, the Tetra Tech company adopted a section of a channel next to Interstate 5 in Orange County. “Their sign is visible to tens of thousands of people who drive past every day,” points out Crompton.
The other is a volunteer model in which environmental groups adopt a section of the channel and use their own volunteers to do the work. They also get recognition on signage.
“We have multiple hundred miles of enclosed channels and aboveground channels and creeks, and to be able to get to all of that, this program allows a lot more frequent removal than would have been possible before,” says Crompton. “It is intended to assist and improve the environment of Orange County.
“Orange County has 42 miles of beaches that are very important,” he adds. “This helps to remove trash and debris and addresses the social issues of trying to prevent blight of our channels and making channels a more appropriate resource in the community. It brings more stewardship and an educational component and a social element to the management of stormwater and urban runoff in Orange County.”
Through Esri Story Maps online, interested parties can examine sections of a channel that they potentially wish to adopt. On the map are color-coded channel sections that, when selected with a cursor, display more comprehensive information. Those viewing the map can see areas that have already been adopted, what work has been done at the site, and what is still available for adoption.
For example, tap on a site on the map that the legend indicates is an area up for adoption and it offers a description like this: Coyote Creek Channel (A01): Harbor Blvd. to Euclid St. (AAC#60). Length: .73 miles. Comments indicate it is a concrete open box channel with a trapezoidal section and access ramp at Cypress Street.
The site then offers further information through an attached PDF file that indicates a moderate level of trash, a very high level of graffiti, a sponsorship cost of less than $3,000 a year, or volunteer adoption costs involving gloves, trash bags, rollers, and paint, among other items.
Other information includes the watershed in which the channel is located, describing its drainage path.
“You can also potentially see what your site would look like if you were to adopt that piece of channel,” says Crompton.
To date, 18 channel sections have been adopted. “Our goal is to expand that over the coming period,” he says. “In each case, we process permits for people to become adopters. We’re trying to accelerate the process of being able to allow adoptions. The Story Maps help that process and shows people what the opportunities are on a geographic basis for them to consider adopting a section of channel.”
Crompton says the Story Maps help the success of the program because while people in Orange County may know where the Santa Ana River or the San Juan Creek is, “a lot of people are not really aware of where the drainage is in their local area.”
It also offers information to volunteer groups on opportunities for projects that benefit the community.
“This gives them, in simple terms, information to make a decision that otherwise they’d be making in a vacuum,” he says. “With this, they can dig down and explore. They can visually see what would be involved in it. We’ve characterized what the problems are and we can steer them to sites that fit their interest and capabilities.”
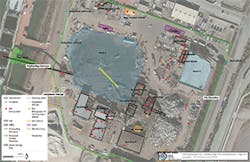
Fire extinguisher map for Sims site
Solving Roadway Flooding
The city of Minot, ND, hired engineering firm Ackerman-Estvold to address a street flooding situation at a roadway intersection that had presented a problem for the last decade. The firm was hired to design storm sewer solutions and develop construction plans and specifications. The project is currently under construction.
The company used Innovyze’s XPSWMM, a hydraulic and hydrologic modeling software combining one-dimensional calculations for upstream to downstream flow with two-dimensional overland flow calculations to enable end-users to view what is happening with a stormwater system, foul water system, or floodplain when waters flow, populations increase, or catastrophic events hit.
“The initial design was done with one-dimensional XPSWMM using some of the built-in stormwater tools. The hydrology was done using SCS methods. I used GIS tools to develop my curve numbers based on soil type and impervious areas,” notes Thomas Johnson, a senior water resources engineer with Ackerman-Estvold. “During the development of the construction plans, we ended up changing some things around. We exported our plans out of AutoCAD into XPSWMM to get the storm sewer changes right.”
Johnson says he modeled the storm sewer downstream of the area as well, because city staff was concerned “if we actually captured more water in the storm sewer, we would be blowing manholes downhill.” Although the actual drainage area was about 200 acres, Johnson modeled some 500 acres of urban area.
The project had a public component as well; people living up a hill from the area were not receptive to the idea of a special assessment district because their neighborhood did not flood, says Johnson. “They didn’t see why they would have to pay for a storm sewer that doesn’t help them, even though it’s the water running off of their property that was flooding other people’s property.”
To address those concerns and further refine the data, Johnson, with the help of a colleague, imported Nexrad data into the model to show the results matched a flooding event on June 4, 2014. Johnson notes that there had been an event at the intersection of focus that was caught on video and could not be duplicated in the model using the recorded rainfall depths and a theoretical hydrograph.
He says he couldn’t get the model to match the flooding event partly due to the variability of the rainfall depth. At the airport, 2 miles north of the site, about 8/10ths of an inch of rainfall was recorded on that day, but at the agricultural station about 2 miles south of the site, about 2.3 inches of rainfall was recorded in 2 hours.
“By importing either of those rainfall data into the model, I could not match what happened,” says Johnson. “My colleague gave me Nexrad data. He gave me a hyetograph for each delineated sub-basin. The rainfall varied from a storm total from about 1.5 inches to 2.3 inches across this 200-acre urban area. I had a great variability just during this storm. I had intensities at a rate of up to 3.5 inches an hour for specific five-minute blocks of time. When I stuffed that into my one-dimensional model, I wound up getting flood elevations similar to what was measured.”
Still, public concerns were not allayed, so Johnson converted the information from a one-dimensional model to a two-dimensional model to get video evidence of flooding that would compare to the video of the results of the modeling. “It must have turned the tide, because it did get approved eventually and it is now being constructed,” he notes.
In using the software, Johnson says, he pays particular attention to volumes and stabilities when considering outputs. “I pay attention to continuity: Do I maintain my volume? How does the volume coming in compare to volume going out?”
By using two-dimensional modeling, the computed runoff from an urban area may be more accurate than that determined using parameters averaged over a sub-basin. He noted in using SCS curve number methodology that the runoff volume from a theoretical sub-basin of two acres—half grass and half pavement—would produce a runoff volume of about 4,000 cubic feet of water during a 2-year storm if the curve number was averaged.
“However, if I split that into two sub-basins—one of them is just pavement and one of them grass—I get 50% more volume from the same two acres,” he says. “When you composite these parameters in a single watershed, you can wind up losing some water.
“With a two-dimensional model, you do composite your grid cells, but instead of having a dozen sub-basins, I’ve got a five-foot-by-five-foot grid, so I’ve got 150,000 little sub-basins. This allows the runoff from the interconnected, impervious areas to arrive at my catch basins much quicker.”
Johnson uses planimetrics, aerial photos, and publicly available data to ascertain impervious areas, land cover, and soil types.
“Then I take my data—usually via an ArcGIS shape file—and I bring it into XPSWMM. If I want to have a nice graphic representing the model results, I export the results back out into ArcGIS and make my map that way,” he says. “The videos that I’ve exported out of XPSWMM, I put straight into my presentations.”
Revitalizing and Protecting Downtown Brampton
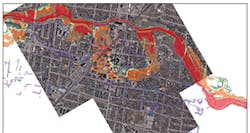
In the city of Brampton in the Canadian province of Ontario, a riverwalk project is expected to be a transformative opportunity to help revitalize its downtown and “make it healthy, sustainable, and resilient,” says Maggie Liu, water resources engineer for the city’s planning and infrastructure services.
“It starts with a large-scale innovative engineering solution to address the flood risk, which will unlock the potential for urban growth, development, and revitalization of the city’s downtown core,” she says. “The stormwater management modeling completed as part of the study will further contribute to the city’s understanding of the flood risks and is a critical tool for assessing potential solutions.”
The driving factors for the project include the ability to better define and predict current flood risks, such as flood elevations, peak flows, and flow velocities and their timing, and recognizing that the complexity of flood flow hydraulics in this area cannot be easily characterized by the current one-dimensional hydraulic model, says Liu.
Additionally, the project is expected to better assess flood mitigation options by considering both riverine flooding and urban flooding mechanisms.
Liu says the goal is to develop a fully functional hydrodynamic hydraulic model of Etobicoke Creek by simulating the interactions among riverine, urban, and overland drainage systems.
The model will be used to characterize flood hazards in the downtown core of Brampton. It also will be used to explore flood mitigation options and to support the design of the preferred mitigation option.
“The flood mechanisms in this area are complex,” says Liu. “During the regulatory storm event, such as the Hurricane Hazel storm, floodwaters from Etobicoke Creek spill into and flow through downtown Brampton along the historic valley before rejoining the creek. Meanwhile, flows back up into the downtown core due to a pinch point at the downstream confluence of the current channel and historic valley.”
The overtopped water interacts with overland drainage systems or flows to the storm sewer systems, potentially causing both riverine flooding and urban flooding, she adds.
Liu says a list of flood mitigation options has been studied to manage existing flood risks. “However, these measures may potentially impede the existing urban drainage system by blocking overland flow routes and exacerbating surcharging in the storm sewer system,” she says. “It is recognized that the hydraulic dynamics in this area cannot be easily assessed using the current one-dimensional hydraulic model. Therefore, a sophisticated hydraulic model is required to dynamically couple the three conveyance systems in order to characterize existing flood risks and to fully assess the implications of the flood protection measure.”
The city of Brampton, in partnership with Toronto and Region Conservation Authority (TRCA), decided to use MIKE Flood by DHI to create a one-dimensional/two-dimensional, three-way coupled model for downtown Brampton.
The package is capable of integrating three conveyance systems into one model, which includes MIKE Urban for the storm sewer system, MIKE 11 for the riverine system, and MIKE 21 for the overland drainage system, notes Liu. The city has been using the software since 2016.
“From a floodplain management perspective, staff at TRCA has been using MIKE Flood successfully since 2013 and now have approximately six areas where the floodplain is derived using MIKE Flood,” says Liu.
“Like anything, using the software frequently aids in reducing the learning curve,” she adds. “The processes used to define the model, including parameterization, are straightforward. The key to a successful model is conducting detailed assessments of the results, identifying issues with model stability, revising model inputs as required, rerunning, and reassessing results—a very iterative process.”
MIKE Flood is a combination of three modeling platforms: MIKE 11, one-dimensional hydraulic model used to represent channel systems; MIKE 21, a two-dimensional overland flow hydraulic model, and MIKE Urban, a one-dimensional hydraulic model used to represent urban sewer networks, says Liu.
“MIKE Flood allows for the coupling of these three models and integrates their results,” she says. “Prior to 2012, MIKE 11, MIKE Urban, and 21 were run independently. The development of MIKE Flood allows for a thorough understanding of the study area hydraulics and allows one-dimensional channel processes to be modeled in a one-dimensional environment, while overland flow processes are modeled in a two-dimensional environment.”
The software can interface with any GIS for pre- and post-processing, but MIKE Flood has the capabilities to complete all the pre- and post-processing within the software, says Liu.
“To our knowledge, this is the first three-way coupled model in Canada and the preliminary results look very promising.”
Updating the SWPPP
In his 12 years with Sims Metal Management, a metals and electronics recycling company, Matt Zeiter has had to address two industrial stormwater permits—an existing one and one that took effect in 2014—and until recently, he relied on consultants to help with the first permit.
Zeiter, the manager of Safety, Health, Environment, Community, and Sustainability for the company’s west region, started using Mapistry three years ago. “Our company was running high dollar amounts just with basic changes within our stormwater pollution prevention plan [SWPPP],” he notes. “Any major changes we would have undertaken would have cost us probably thousands of dollars to revise at a consultant level.”
Using Mapistry, Zeiter says he’s been able to take ownership of Sims Metal Management’s SWPPP that covers seven of its California facilities.
“It allows me to make simple name and narrative changes within the SWPPP itself,” says Zeiter, who was awarded “Best Mapmaking Skills” by Mapistry.
“Maps are a huge part of the new permit where different items are required to satisfy the new SWPPP requirement,” he says. “I was able to create the maps on a base level.”
Mapistry includes features that enable him to determine the actual square footage of Sims Metal Management’s facilities and square footage of the buildings and other structures at the facilities. “It’s good knowledge to have, which we didn’t have at first,” says Zeiter.
He has an AutoCAD background, “so it did allow me to navigate the mapping software a lot easier than somebody who probably has never used any kind of software like AutoCAD in the past, but just having exposure to both pieces of software, I would say the Mapistry tool is a lot more user-friendly than general CAD software,” he says.
“It’s been invaluable to our overall cost savings. It’s allowed me to go in and continue to monitor and own the program. There was a time where we weren’t using consultants and I didn’t have the Mapistry software yet, so I was using primitive methods to make changes.”
Zeiter notes that while Mapistry has been an effective tool for SWPPPs, its capabilities have also been useful for other documentation required in California, such as the company’s hazardous materials business plan, which requires a site map with locations of how the company stores hazardous materials and hazardous wastes.
“I’ve also used it in the capacity of our spill prevention counter controls,” he adds. “I’ve been able to map out where we have aboveground storage tanks and reservoirs. From a basic yard maintenance compliance standpoint, I’ve used it to the extent that I’ve mapped out every single fire extinguisher, fire hose, and fire suppression effort. It brings not only the environmental piece, but I’ve started using it for safety stage mapping as well.”
Zeiter says he appreciates that he is able to give Mapistry feedback on how the software can be improved to best meet his needs.
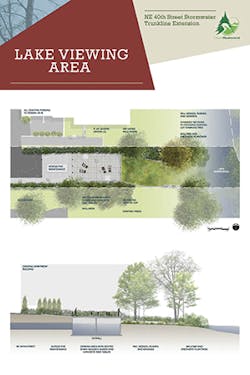
Plans for the NE 40th Street stormwater trunkline extension in Redmond, WA
Planning for Future Development
In Redmond, WA, a hydrologic and hydraulic modeling project by Otak, an engineering, architecture, urban design, and planning firm, seeks to determine how to increase the percentage of direct discharge to Lake Sammamish to accommodate expected future development in the drainage area while maintaining and enhancing base flows to Villa Marina Creek.
An Otak team is working in conjunction with the city to determine the appropriate storm sewer pipe sizes for the NE 40th Street stormwater trunk extension. The project involves 328 acres and is complicated by a flow splitter in the trunkline that diverts some of the flow to Villa Marina Creek, a tributary to Lake Sammamish.
Stormwater modeling of the NE 40th Street trunkline was used to evaluate storm sewer capacity and identify locations where culvert upsizing will be required. Additionally, a new stream reach segment that connected flow from NE 40th Street to Lake Sammamish needed to be designed based on the goal of not increasing flows to Villa Marina Creek.
Long-term hydrologic and hydraulic simulation runs were required to determine the flow duration in Villa Marina Creek for both the existing and future conditions. Long-term modeling runs were also required to evaluate the full range of possible flood events.
Otak used the new WWHM-SWMM stormwater modeling software developed by Clear Creek Solutions to model the NE 40th Street trunkline and the Villa Marina Creek watershed. WWHM-SWMM combines both HSPF hydrology and SWMM hydraulics in a single integrated package. HSPF was used to compute 60 years of 15-minute continuous runoff from the drainage area. EPA SWMM 5.1.012 was used to route the HSPF-calculated runoff through 47 SWMM catch basin nodes to Villa Marina Creek and Lake Sammamish.
WWHM-SWMM offered advantages in time and money savings, notes Doug Beyerlein, co-founder of Clear Creek Solutions. “One of the most time-consuming aspects of combining HSPF and SWMM is the need to extract flow data from HSPF and then manually load each individual hydrograph into the SWMM model at each linkage point,” he explains. “With WWHM-SWMM, there is no need to do this manually. The HSPF flows are saved in a binary interface file format that is identical to the format SWMM 5.1.012 uses. In this way, SWMM can be run without having to load the hydrographs.”
Beyerlein points out another critical time-saving aspect: “Normally a long-term continuous run is not attempted in SWMM because of very long computer run times. In the case of this NE 40th Street model, a normal long-term modeling run would take between 36 and 48 hours of real computer time. By using WWHM-SWMM’s TurboSWMM feature, this run time was cut to just four hours.”
TurboSWMM uses multiple computer cores spread over a network of computers to simultaneously run multiple model time periods.
“For example, using a maximum of 60 computer cores, a single 60-year SWMM run can be reduced to only 30 minutes,” says Beyerlein. “This results in more than just a time savings; it actually makes possible analysis that could not be performed without TurboSWMM. The 60-year simulation run made it possible to perform flow duration analysis and flood frequency analysis, and removed the reliance on a single flood event.”
He adds, “WWHM-SWMM also includes the option of identifying and modeling single flood events. For this project, it was also required to model the 50-year flood. From the long-term simulation and accompanying flood frequency analysis, the 50-year flood was selected based on peak magnitude from simulated flood events.
“Because no single modeled flood event was a direct match to the 50-year flood frequency value, a larger flood event was scaled down slightly to match the 50-year flow. This was all done with WWHM-SWMM analytical tools.”
