This article explores the results of an in-stream chloride study conducted in Vermont over the course of 22 months from early 2014 to late 2015. It discusses the general chloride trends observed during this time and how they relate to weather events and deicing activities. It also discusses how municipalities with chloride regulations can develop their own simple monitoring programs for compliance. Finally, the current state of best management practices is explored in an effort to provide a means by which communities can begin to reduce chloride contributions to local water resources.
Chloride in Vermont: A Brief History
During the past several years the main focus of water quality management in Vermont has been nutrient loading, specifically phosphorus, to Lake Champlain. The lake is a highly popular draw for recreation, attracting thousands of visitors and generating substantial revenue. The lake is a source of drinking water for 145,000 people within Vermont (“Drinking Water–Lake Champlain Basin Program,” n.d.). Urban and agricultural runoff, combined sewer overflows, and in-stream erosion have resulted in nutrient pollution causing toxic algae blooms, which have ratcheted up the level of concern amongst citizens, politicians, and regulators. Diminished water quality has led to the development of a phosphorus total maximum daily load (TMDL) and a statewide push for nutrient reductions (“Restoring Lake Champlain,” n.d.). For these reasons, chloride has played a backseat role to the greater concern of nutrients, although in Vermont and nationwide, the scale and implications of chloride pollution, primarily from deicing of roads, sidewalks, and parking lots, has now been thrust into the spotlight.
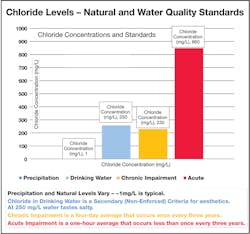
In 2014, Vermont added chloride to the State Water Quality Standards. The standard adopted was an 860 mg/L acute criteria and 230 mg/L chronic criteria (Figure 1). The acute criteria, equal to the maximum allowable concentration (MAC), is defined as the highest concentration to which aquatic life can be exposed for a short period of time (one-hour average) once every three years without deleterious effects. The chronic criteria, equal to the average allowable concentration (AAC), is defined as the highest concentration to which aquatic life can be exposed for an extended period of time (four-day average) once every three years without deleterious effects (VT DEC 2014a).
This standard, originally developed by EPA in the 1980s, has also been applied in other cold-weather states including New Hampshire and Minnesota (USEPA n.d.). The new chloride standard has set into motion monitoring by public and private entities to establish baseline chloride concentrations, which vary over the diurnal, seasonal, and hydrologic time series, as well as by watershed characteristics. Historically, only limited monitoring of chloride has been performed in Vermont urban streams, which has been useful to give managers an indication of the magnitude of chloride concentrations (Denner et al. 2009). However, a major drawback has been that winter data have been largely absent from datasets due to potential freezing of streams. To understand how chloride levels compare to the new water-quality standard, monitoring is needed throughout the season, as understanding winter chloride levels is critical to implementing management practices.
This was the main driving force to monitor and assess Sunnyside Brook in Colchester, VT.
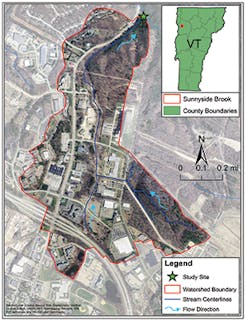
Sunnyside Brook is a typical urbanized stream. Located in Colchester in the northwest portion of the state, the stream drains highly developed urban lands (Figure 2). The watershed area is 350.6 acres, 106.2 of which are impervious. Presently the stream is listed as “stressed” by the state because of past dumping, land development, and runoff (VT DEC 2014b). Sunnyside Brook is a tributary of Sunderland Brook, a flow-impaired stream that outlets to Lake Champlain.
Methods
Monitoring for chloride does not necessarily require a large, continuous dataset, but developing one for a representative stream within your area of concern can certainly help predict times of year or specific events when typical background levels or exceedances might be observed.
The most useful and easily gathered data measurement is conductivity, a measurement of an aqueous solution’s ability to conduct electrical current. A solution’s conductivity increases with the presence of dissolved ions; therefore a chloride (Cl-) ion will elevate conductivity. Conductivity measurements, in ohms or microohms per centimeter, will typically be expressed as specific conductance (SC), which is conductivity normalized by temperature to 25°C.
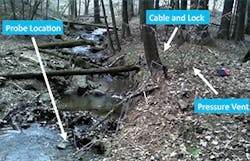
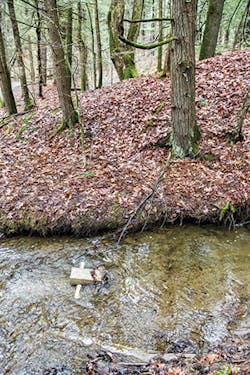
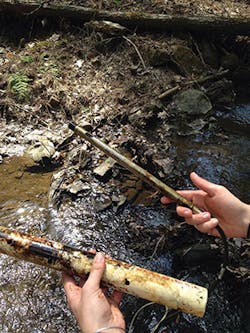
During our study, more than 45,000 15-minute-increment specific conductance measurements were taken using an In-Situ AquaTroll 200 titanium sonde with temperature, pressure, and conductivity probe tips. The sonde was installed inside a horizontally mounted perforated PVC pipe and anchored to the streambed using natural materials (large stones) or a concrete block (Figures 3 through 5). Using a perforated PVC pipe around the probe will protect the sonde, but can increase sedimentation. This configuration is not necessarily ideal; sedimentation can occur. Sediment can interfere with measurements because of the increased dissolved ions around sediment particles. A more preferable installation is to install the probe vertically in a perforated pipe stilling well that resists sedimentation.
Data were collected approximately every two weeks using a laptop and In-Situ’s Win-Situ software. The sonde was used in its original factory-calibrated condition. Regular maintenance as prescribed by In-Situ was performed to prevent fouling of the sonde’s sensors.
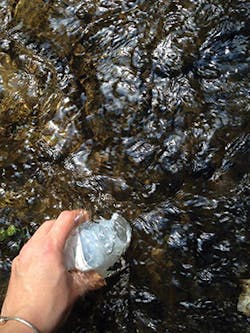
To establish a relationship between specific conductance and chloride concentrations, grab samples were obtained using sterile, triple-rinsed containers (Figure 6) per VT DEC Field Methods Manual section 4.1.4, Anions/Nutrients Sampling, and transported immediately to a local EPA-approved laboratory (Endyne Inc. in Williston, VT) for chloride analysis using USEPA Method 300.0, Determination of Inorganic Anions by Ion Chromatography (VT DEC 2006, Pfaff 1993). Measurements and samples were then timestamp-matched and chloride concentrations in mg/L were calculated using a simple linear regression analysis equation. This method has been shown to be robust in other studies of chloride using conductivity as a proxy (Granato and Smith 1999). Collecting grab samples at various flow conditions (precipitation-induced, freeze-thaw cycles, seasonal high- and low-flow conditions, etc.) ensures that a broad range of chloride concentrations is represented.
Data were collected and analyzed in an Excel spreadsheet. Chloride impairment standards are expressed as one-hour and four-day averages. These averages were generated within Excel from the 15-minute interval data using a “moving average” function for each of the specific impairment standard intervals.
Results
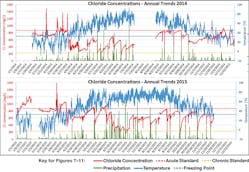
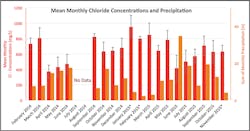
The overall mean chloride concentration in Sunnyside Brook during the 22-month monitoring period at Site RM02 was 645.6 ±193.3 mg/L. We noted several clear trends between stream chloride concentrations and seasonal trends as well as episodic precipitation and temperature events. Overall, chloride concentrations were consistently higher in the winter (mean concentration of 768 and 831 mg/L for the winters of 2013-2014 and 2014-2015, respectively) and lower in the summer (mean concentrations of 619 and 553 mg/L for the summers of 2014 and 2015 respectively) with precipitation- and temperature-driven variability (Figure 7).
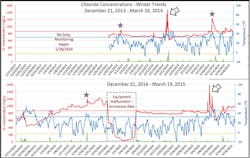
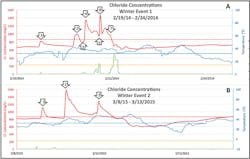
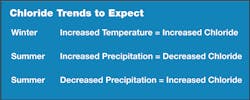
Although these seasonal differences were not statistically significant, monthly averages often were. During the winter months when temperatures rose near or above the freezing point, we noted a sharp increase in chloride concentrations (Figure 8). During periods of frozen ground, chloride was washed off the ground, and this chloride-laden runoff was transported either directly to the stream via connected impervious surfaces or introduced via stormwater infrastructure. Precipitation during the winter increased in-stream volume and caused a dilution in chloride concentrations (Figure 9).
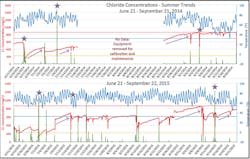
In the warmer months, chloride levels averaged lower than the winter months and a dramatic inverse relationship was noted between precipitation and chloride concentrations in stream (Figure 8). During periods of thawed ground, chloride tends to leach slowly from soil as baseflow to streams. When precipitation was low, the chloride-rich groundwater dominated the stream flow and chloride concentrations steadily rose until a rain event occurred.
Vermont’s recently adopted chloride standards, a chronic level of 230 mg/L observed over a four-day average and an acute level of 860 mg/L observed over a one-hour average, were used as a guideline for data interpretation. Neither the one-hour or four-day moving averages were significantly different from the overall average chloride concentration.
Over the course of the study, chloride levels in Sunnyside Brook only dropped below the chronic concentration for less than one day, on July 7, 2015, following a very rainy June and early July. June 2015 had the most precipitation of any month of study, and these consistent diluting rain events decreased chloride concentrations significantly (Figure 8). Chloride concentrations exceeded the acute standard on 32 separate occasions. These exceedances, which ranged from one hour to 20 days in length (mean length of 40 ±92 hours), were likely due to the antecedent weather conditions, primarily occurring when a period of below-freezing weather was followed by a warming trend where temperatures climbed above freezing, resulting in melting snow and ice and subsequent runoff from impervious surfaces and via stormwater infrastructure into the brook. Only two of the 32 exceedances (6%) occurred in non-freezing times of year. Both of these short exceedances (< 1 day) occurred in September 2014 and exceeded the acute level by a maximum of 2.2 mg/L. These high chloride concentrations occurred as a result of a dry September that served to concentrate baseflow-related chloride (Figure 8). September 2014 had the lowest precipitation total of any non-winter month during this study.
Winter Trends. The most significant driver of in-stream chloride concentrations during winter months was tem-perature. When temperatures rose to near or above freezing, snow and ice on roadways and parking lots beganto melt, allowing chloride-laden runoff to make its way into the stream network. Figure 9 illustrates this relationship with some examples called out with stars. For example, in early February 2014 the temperature rose to 37°F and in response chloride concentrations quickly rose to 893 mg/L. There were several very high chloride spikes observed in the two winters of study, including the highest chloride concentrations for the monitoring period (1,472 and 1,577 mg/L; arrows 1 and 2, respectively, in Figure 9). Unfortunately, between January 27 and 29, 2015, our equipment recorded erroneous data a result of very cold temperatures that froze nearly all of the water in the stream at the sampling location. These data were excluded from analysis but are shown in Figure 9 to illustrate the difficulties of continuous monitoring in cold climates.
When winter warming periods were coupled with precipitation, we observed dramatic fluctuations in chloride concentrations. In one particular storm in late February 2014, the temperatures warmed after an extended cold period, and a chloride spike was noted (Figure 10, event A). Temperatures then cooled and warmed again, accompanied by another rise in chloride (Figure 10, event B). Rainfall was then observed, which diluted chloride concentrations (A3). It was warm enough that deicing activities were unlikely for this storm. The warming trend continued, and another chloride spike was observed (A4) due to washoff from melting snow and ice. It is likely that the snowpack was destabilized by the preceding rainfall, resulting in a chloride concentration spike. Another precipitation event then occurred. This event was a mix of snow and rain, likely necessitating chloride application. Although there is an initial chloride dilution (A5), it quickly spikes to 1,433 mg/L (A6) as a result of chloride from recent deicing activities as well as snow and ice melt from the existing snowpack. Another larger precipitation event occurred, and we see another chloride dilution (A7) before chloride concentrations return to a winter normal as temperatures fall.
When an extended cold period preceded a warming event, higher in-stream chloride concentrations were observed. For example, we observed three notable chloride spikes (Figure 10, event B) in response to diurnal warming patterns over a three-day period following a period of 41 days with only two brief periods above freezing (< 1 day), which was not significant enough to produce a notable melt. During this early March period, chloride concentration rose to 1,095 mg/L (B1) as initial melt from existing snow and ice made its way to the stream when temperatures reached 34°F. Overnight, temperatures again fell below freezing and chloride concentrations declined. The following day, temperatures rose to 42°F and stayed above freezing for most of the day. As this was the warmest day in more than 60 days, the observed chloride spike (B2) was higher than any other observed during the period of study (1,577 mg/L). Temperatures fell overnight, but remained near the freezing point. As such, chloride levels remained well above the winter average (>900 mg/L). On the third consecutive day of this warming period, we see a third chloride spike (B3) in response to the even warmer temperatures (maximum of 48°F). At this point, even though temperatures remain above freezing, it is likely that most of the available meltwater had entered the stream, and chloride levels returned to a winter normal.
Summer Trends. In the summer, when no deicing activities are taking place in the watershed, in-stream chloride concentrations are a result of chloride present in groundwater. During summer conditions, there are two basic trends that were noted during the monitoring period. First, when a precipitation event occurred, chloride concentrations were diluted by the first flush of rainwater washing off the land surface and conveyed via stormwater infrastructure to the stream. We noted this each time a rain event occurred (Figure 11; see stars for examples), with the magnitude of dilution dependent on the antecedent in-stream chloride concentrations and the scale of the rain event. Second, when a period of time passes without a significant rain event, chloride concentrations rise as a result of volume reduction in the stream (Figure 11; see arrows for examples). When this occurs, the chloride from shallow groundwater dominates hydrology with minimal additional inputs. As the stream returns to baseflow conditions, chloride is concentrated (Figure 12).
Developing and Implementing a Monitoring Program for Chloride
Monthly average chloride concentrations with error bars displaying the standard deviation are shown
in blue and the sum of monthly precipitation is shown in orange. A “*” Indicates that this month
has a gap in data. Months with less than 75% complete data were omitted from this figure.
This section deals with understanding what chloride standards are and how to create a robust, yet fairly simple, monitoring program that can accurately gauge chloride levels in local waterways.
Chloride Standards: What They Are and Why That Matters for Monitoring. As noted before, chloride standards are typically measured as one-hour and four-day averages. This is important to know for monitoring or management programs, as it will be necessary to monitor in-stream chloride levels over a relatively long time period at fairly short time intervals. For example, you might be able to detect an exceedance of the acute standard by conducting grab sampling over the course of a day, but this is time-consuming and difficult. Additionally, it would be very easy to miss exceedances driven by melting snow and ice, or by a winter rain event that quickly flushes a high concentration of chloride.
Monitoring programs should rely on automated sampling equipment, though using a hand-held probe for spot-checking can be useful in determining automated sampling equipment placement.
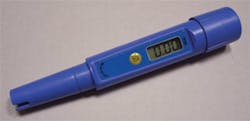
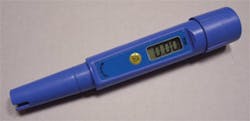
How to measure for SC. There are two basic means of measuring chloride (other than grab-sampling for lab analysis). The first is the use of a simple hand-held probe that will give an immediate reading of conductivity (Figure 13). This is usually expressed as specific conductance—a temperature-independent value. These hand-held probes can be purchased for about $100-200 and will usually also measure temperature, pH, or total dissolved solids. Hand-held probes can be used if you are managing a large watershed, or watersheds where there are numerous potential sites along a stream that could be monitored long-term. By doing periodic spot-checking using these simple probes, you can begin to assess where potential chloride hot spots may be. This can then help you make your next decision—where to install long-term monitoring equipment.
The easiest long-term monitoring equipment to use is multi-parameter sondes that measure for a variety of parameters including temperature, pressure, and conductivity at short time intervals. It is outside the scope of this article to review conductivity data loggers; however, both YSI and In-Situ make loggers that are fairly commonly used. This is the bare minimum to be able to monitor for chloride, as a relationship can be established using specific conductance and chloride concentrations.
These sondes usually cost more than $2,000 with associated cables, equipment, and software. Because of their expense, it’s important to know where monitoring should take place before purchasing numerous sondes.
A typical setup for a long-term deployment is to find a location on a stream, such as bridge abutment, where a simple PVC stilling well can be installed. An anchored vertical stilling well will protect the sonde from stream debris, as well as prevent the sonde from becoming buried in sediment or being carried away during high-flow events. Sediment carries a relatively high load of potentially disassociated ions, which can skew results. If relying on pressure to establish a stage-discharge relationship to apply to chloride data, be sure to accurately set up the stilling well and sonde to account for the sonde’s height above the stream bed.
Once the sonde is installed and set up according to the manufacturer’s guidelines, the establishment of a chloride-conductivity relationship can begin.
Establishing a Chloride-Specific Conductance Relationship. As explained previously, conductivity is the ability of water to pass an electrical current due to the presence of dissolved ions—any dissolved ions, not just chloride. To relate conductivity to dissolved chloride, paired measurements must be made as outlined in the Methods section to support development of simple linear regression analysis.
Regression Analysis for Chloride-Specific Conductance Relationship. Establishing this relationship for a specific site or watershed can be complex, though the basic premise is simple. Obtain time-matched measurements and grab samples. Once the sample has been analyzed for chloride in the lab, pair measured chloride concentrations with specific conductance readings from the probe to develop a simple linear regression equation. This is most simply accomplished using a spreadsheet program like Microsoft Excel and fitting a line to the two variables. The equation returned will then relate measured specific conductance to chloride concentration. There is also evidence that using a line of organic correlation can return good results, though this method is more complex (Granato and Smith 1999).
Developing a strong relationship can be difficult. It requires both numerous paired measurements to obtain a relatively high sample number, or n, as well as samples obtained at different chloride concentrations in the stream or water body. As shown in the chloride results obtained from our sample site, this can mean sampling during different melt-freeze periods, drier “baseflow” periods, and rainier dilution periods. This will provide a spectrum of events that will more accurately create the regression equation. Many states, such as Vermont and New Hampshire, are developing or have developed their own equations to use for compliance.
Note that with our initial regression equation, our R-squared value is quite low. This is likely due to the low n, as well as the preponderance of measurements at the higher end of the chloride spectrum. Because of this we chose to use the NH DES chloride regression equation because their sample was more numerous and diverse than ours.
How to Digest Data for Compliance: Excel-Based Method for Moving Averages. Once you have developed a regression equation, or chosen to use an established, appropriate equation, the next task is to monitor the data accurately for compliance. Chronic and acute standards are based on one-hour and four-day averages. It can be tempting to break data into one-hour and four-day blocks based on calendar time, but this risks missing times that concentrations exceed thresholds. For that reason it is better to use moving averages based on 15-minute-increment data.
Excel makes this relatively simple. Under the “Data” tab, choose the “Data Analysis” option. If you don’t initially see this option, choose File → Options → Add Ins and add the “Analysis ToolPak” to the ribbon. Choose “Data Analysis,” which brings up a dialogue box where you can choose “Moving Average.” This brings up an input box. The “Input Range” is your 15-minute measurements of specific conductance converted to chloride concentration using the regression equation. The “Range” changes depending on the standard—use a range of four (four 15-minute intervals) for the one-hour acute standard. Use a range of 384 (384 15-minute intervals) for the four-day chronic standard. For the “Output Range,” choose a column to output the results to. You now have one-hour and four-day moving averages for all data. Simply fill down as more data are acquired.
Spotting Trends: How to Do This With Weather Data. In our study we wanted to ascertain what events or conditions influence in-stream chloride concentrations. To understand these conditions, we relied on weather data collected and published by Cornell University’s Northeast Regional Climate Center, which collects temperature and precipitation data from Northeastern weather stations. They provided us with data in one-hour increments that we then interpolated to 15-minute increments to match our specific conductance measurements.
Although the National Oceanic and Atmospheric Administration (NOAA) also collects these data, we did not use them because the 15-minute-interval data were not up to date. These data may be useful in other regions, however.
Another option would be to use data from a Weather Underground private weather station. These stations often provide data in tabular form for spreadsheet integration. Obtaining the data can be difficult, involving downloading daily data individually (time-consuming) or creating an automatic download using a developer’s API key. While this is possible, it was outside our technical expertise to accomplish in a timely fashion. Additionally, Weather Underground private weather stations are not always correctly calibrated or quality-controlled for accuracy, which can introduce errors.
It would be best to use a dedicated weather station within the watershed. However, this requires an additional level of maintenance and expense. From a compliance standpoint, this additional step would not likely be necessary—it’s more a matter of academic interest.
Best Management Practices
Road salts impact natural cycles and ecosystems that occur in small streams like Sunnyside Brook; however, these impacts also occur at a watershed scale. Chloride contamination from road salts is becoming increasingly problematic. In the cold winter months, Vermont and other states with cold climates use various road salts to clear roadways, driveways, and parking lots to enable safe travel. However, the journey that a grain of road salt takes is longer than most people consider, particularly because it happens out of sight. Salt is mined, distributed, stored, and then spread on roadways. It then enters local waterways through rain, snow and ice melt, or wind. Once chloride dissolves in water, it can follow the groundwater’s path to surface waters, soil, or uptake by vegetation. This is not only a concern for the environment but also can have implications for human drinking water supply and health.
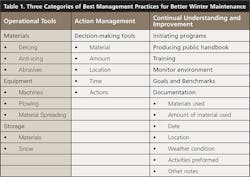
Unfortunately, there’s no easy solution for removal of chloride contamination once it has entered the environment; it can take decades to naturally flush out of a watershed, as there are no natural processes that effectively eradicate it. Traditional structural BMPs like detention ponds, gravel wetlands, and infiltration swales are very effective at reducing other pollutants found on the roadways. However, they’re ineffective for treating chloride. The only effective current solution to this growing problem is to reduce application or to more effectively target application. Three categories of BMPs, that not only aid in transportation safety and reduce costs but also eliminate excessive chloride in our waters, are operational tools, action management, and continual understanding and improvement (Table 1).
Much research is currently focused on new technologies that keep roadways safe in harsh winter conditions and reduce environmental impacts, with a primary goal being chloride reduction or even elimination. One technological advancement that has been implemented in locations throughout North America is snow and ice melting (SIM) systems. These SIM systems are hydronic or electric systems that function by heating a surface to remove snow and ice buildup or prevent initial buildup. These systems are very versatile and can be implemented within sidewalks, steps, driveways, roads, parking lots, helipad landings, or any other location where snow and ice buildup could impede transportation. Sensors and weather anticipation tools are being used alongside SIM systems to improve safety and reduce energy use. Solar-powered SIM systems are also being explored to further cut costs and lessen environmental impacts.
Other innovations have helped reduce salt applications, such as cheese brine byproducts used alongside salt as a pre-wetting solution to lower the freezing point on road surfaces and help salts stick better to road surfaces. These have been used in Balsam Lake County, WI. Other materials to lower the freezing point on roads have also been studied, including beet juice, sugar cane molasses, volcanic minerals, and tomato juice. Washington state is working to find ways to limit the amount of salt that needs to be applied to the roads and reduce the amount of plowing by adding small particles to concrete that prevent ice from bonding to the road surface. These advancements and numerous others not described here are helping to reduce the amount of chloride introduced to the landscape. Many communities and towns across the country have implemented programs and plans to work toward this goal.
Table 1 shows examples for each of the three categories where BMPs can be applied to improve water quality.
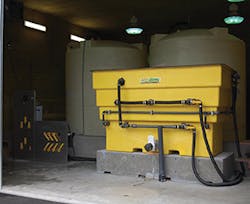
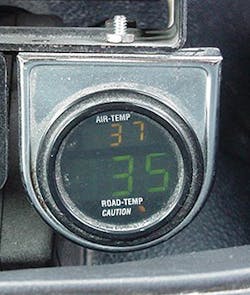
Highway-Related BMPs: A Vermont Case Study. The Vermont Agency of Transportation (VTrans) maintains more than 6,000 miles of public roads in a snowy, icy climate with a budget of around $25 million for snow and ice control. To reduce this amount and minimize the effects chloride has on the environment, VTrans has instituted a Snow and Ice Control Plan (VTrans 2013). This plan hinges first on an acceptable level of service, roughly translated as “safe roads at safe speeds” and not “bare roads.” Drivers are encouraged to slow down, versus expecting roads to always be snow and ice free. Additionally, VTrans has developed a comprehensive suite of options for deicing, hinging largely on anti-icing using pre-wetted ~23% salt brine solution, aggressive plowing to reducing deicing needs, and calibrated deicing material application. Calibrated deicing relies heavily on ground-speed controls (to assess application rates more accurately), road temperature sensors (as road temperature, not air temperature, is the chief driver of road icing), a distributed Road Weather Information System (RWIS), and a distributed network of salt-brine production tanks (Figure 14). Carefully managing information and resources allows VTrans maintenance crews to better manage application rates, reducing overall use of chloride while maintaining an acceptable level of service on the highway network. Figure 15 shows a road temperature gauge.
Targeting Deicing Application at the Municipal Level: Lake George, NY. Lake George, in New York’s Adirondack Park, is a critically important resource for tourism, recreation, and the regional economy. Water-quality monitoring has been conducted in Lake George for more than 30 years. The Fund for Lake George “State of the Lake Report” released in 2009 highlights rising chloride levels as a primary threat to water quality, as monitoring has shown chloride concentrations 30 times above natural background levels and rising. Concerns about the rising chloride concentration in this fragile ecosystem have spurred efforts by the Fund and Lake George Village to embark on a pilot study to measure deicer application rates on two village trucks. According to Chris Navitsky, Lake George Waterkeeper, the amount and distribution of applied deicing materials is largely unknown because of the limitations of existing equipment. As part of the pilot study, black boxes fitted with GPS equipment running Viaesys Material Tracking software work to track deicing application rates and spatial distribution during storm events over the range of temperature and precipitation conditions that occur during storm events. According to Navitsky, “Now we will actually know in a 1-inch storm at 25 degrees what we are adding, and then we can start to develop a baseline for application rates.” Getting more refined data using this “smart plow” system is a key step toward improved tracking of deicing application rates, which in turn will allow for more targeted and therefore more efficient distribution.
Working with Private Snow- and Ice-Removal Companies: New Hampshire’s Green SnowPro Program. As a cold-weather state with a large demand for deicing, New Hampshire has its share of chloride-impaired waterways. In an effort to reduce chloride inputs to water resources, the state has made significant progress to better inform private snow-removal professionals about efficient and chloride-friendly winter maintenance activities. The Green SnowPro Training program is voluntary day-long training that covers the basics of salt reduction, including equipment calibration and alternative methods such as brine, pre-wetting, and modification of application rates with pavement temperature. Contractors who attend the course and pass an exam are eligible to apply for a State Salt-Applicator Certification. The program benefits the contractor because materials are saved by better calibration, and the Green SnowPro Certification provides a way for businesses to market themselves as “green.”
One major impediment to deicing application rate reduction is a concern by property owners that slip-and-fall injuries will lead to legal action. The State Salt-Applicator Certification also addresses this critical concern by granting liability protection against damages arising from snow and ice conditions, including slips and falls. The program also requires annual reporting of salt accounting, which can be a good check for both applicators and state program managers on the amount of deicing materials being applied during a given year.
More information can be found at http://bit.ly/28IAQiC.
Conclusion
We hope this article has provided a better understanding of the potential impacts of chloride on our natural waterways, as well as a grasp of how to better characterize and manage chloride inputs to these ecosystems from deicing activities. Monitoring for compliance with chloride does not have to be an overly complicated process with some relatively simple equipment, software programs, and the proper application of knowledge. Management, while more complex than monitoring, has a number of proven precedents in cold climates that can potentially have a large effect on chloride in natural ecosystems, bringing communities closer to meeting compliance standards.
Works Cited
Denner, J. C., S. F. Clark, T. E. Smith, and L. Medalie. 2009. Effects of Highway Road Salting on the Water Quality of Selected Streams in Chittenden County, Vermont, November 2005–2007.
Drinking Water – Lake Champlain Basin Program. (n.d.) Retrieved February 16, 2016, from www.lcbp.org/water-environment/human-health/drinking-water.
Granato, G. E., and K. P. Smith. 1999. Estimating Concentrations of Road-Salt Constituents in Highway-Runoff from Measurements of Specific Conductance. USGS Water Resources Investigation Report 99-4077. http://pubs.usgs.gov/wri/wri99-4077/pdf/wri99-4077.pdf.
Pfaff, J. D. 1993. Method 300.0 – Determination of Inorganic Anions By Ion Chromatography. United States Enviromental Protection Agency.
Restoring Lake Champlain. (n.d.) Retrieved February 16, 2016, from www.watershedmanagement.vt.gov/erp/champlain.
USEPA. (n.d.). National Recommended Water Quality Criteria- Aquatic Life Criteria Table. Retrieved from www.epa.gov/wqc/national-recommended-water-quality-criteria-aquatic-life-criteria-table.
Vermont Agency of Transportation. 2013. Snow and Ice Control Plan.
VT DEC. 2006. Water quality division—Field methods manual, 1–117.
VT DEC. 2014a. Water Quality Criteria for the Protection of Human Health and Aquatic Biota, Appendix C. http://dec.vermont.gov/sites/dec/files/wsm/Laws-Regulations-Rules/mapp_appxc_pres_2-3-14.pdf.
VT DEC. 2014b. Stateof Vermont Stressed Waters List.