“The most exciting phrase to hear in science, the one that heralds new discoveries, is not ‘Eureka!’ but ‘That’s funny’….” -Isaac Asimov
We are in a time of transition from a pollution reduction approach to stormwater quality management to one of volume-reduction. The volume of runoff itself is the pollutant of concern (or carries it). Being able to get rid of rainfall through evapotranspiration, infiltration, or alternate use (aka green infrastructure) before it becomes runoff is the current target both de jure and du jour. As with every transition before, there will be a diversity of ideas followed by a slow coalescence of opinion, implementation of regulations, and, eventually, practice around a particular approach or two. If it has a catchy name and good documentation, makes some logical sense, and has some respected proponents, then an approach has a good chance of being in the final running. Of course, there will always be outliers and one-of-a-kind approaches dictated by climate, topography, or the fact that you reside in California. But most of us simply want to know something has been successfully implemented in a few places, is acceptable to our regulator, and results in designs and sites that do the job well, protect and preserve important environmental amenities, and can be built by normal contractors and maintained by normal property owners.
Unlike the current pollution reduction approach, in which only engineered controls have a recognized ability to reduce stormwater pollution, under the runoff reduction approach, every land surface can now have an assigned rating in terms of percent average annual rainfall volume reduction (should we just call it AAR?). Even impervious surfaces do not have 100% runoff. Volume is the new pollutant, and volume reduction equals pollution reduction. Thus, understanding and even calculating every aspect of a site’s land condition vis-a-vis volume removal is important.
This is a big change. HSG Type A soils are like money in the bank!
One such method, gaining ascendency for the above-mentioned reasons, is called the Runoff Reduction Method (RRM). It is basically an extension of past stormwater management approaches interposing volume-related considerations and calculations at the front end of normal site development or redevelopment, and volume considerations throughout. Several states have adopted versions of it, and seminars and various forms of documentation abound on the Internet. Perhaps the two clearest articulations of the approach have been developed by Tom Schueler of the Chesapeake Network (CSN n.d.) and by David Hirschman and Kelly Collins of The Center for Watershed Protection (CWP 2008). The reader is referred to these references to gain an appreciation for the level of background and experience that undergird the method’s development.
Get ready for new acronyms, too.
Why This Article?
Tennessee is one state that is adopting some form of the RRM, at least obliquely, through its statement of permit requirements for permanent stormwater controls (the wording here is seen as a probable model for the rest of the state; it should be stated that at this writing that issues discussed here have not been fully resolved through adoption of policy or criteria):
The MS4 must implement and enforce permanent stormwater controls that are comprised of runoff reduction and pollutant removal. If runoff reduction and/or pollutant removal cannot be accomplished … then the MS4 may propose offsite mitigation and/or payment into a fund for public stormwater projects.
Site design standards for all new and redevelopment require, in combination or alone, management measures that are designed, built and maintained to infiltrate, evapotranspire, harvest and/or use, at a minimum, the first inch of every rainfall event preceded by 72 hours of no measurable precipitation. This first inch of rainfall must be 100% managed with no discharge to surface waters.
This wording seems simple on the face of it: catch and remove the first inch of rainfall. However, it gets complex when you ask a few simple questions–the kind pesky designers and developers always seem to ask:
- When you say “one inch,” what do you really mean? Do you mean volume, depth, or percent rainfall removal?
- You say a tree catches 0.035 inch in its leaves. I know trees do better than that! How do I get credit for trees, amended soils, different soil types, etc. against that 1 inch?
- One size doesn’t fit all, you know. How can you be sure this fits our local situation?
- How do I size a runoff reduction practice (RRP)? You say one inch, but is it assumed to be dry? Can I get credit for infiltration during the storm?
- We’ve got lots of yards; if I sheet-flow rainfall onto my yard, can I get more credit than if I directly connect it? If so, how much?
Potential responders to the questions are often stumped about how to answer, or even sometimes give contradicting information(!). I have personally been in similar conversations in four different states and the stumping seems fairly widespread.
We faced these questions in Nashville as we prepared for the Phase I permit to become final, and we decided try to 1) remove the ambiguity as much as possible, and 2) ground-truth the method using local data and more rigorous analysis techniques where appropriate. The purpose of this article is to share some of that thinking and those results in an attempt to assist others who are seeking to interpret the approach to cagey site designers who have just begun to discover loopholes, inconsistencies, and opposing arguments.
This article is about the results of these two efforts.
We defined the following objectives to guide our efforts. Nashville’s interpretation of the state RRM-based criteria should:
- Try to ensure compliance with the State of Tennessee stormwater permit requirements for Nashville;
- Recognize the volume-reduction capabilities of such non-engineered land-use features as open space, trees, and disconnected impervious areas;
- Reflect the best understanding of the most current RRM nationally;
- Reflect local rainfall and other characteristics where appropriate; and
- Balance simplicity of concept with accuracy of analysis and results.
For those unfamiliar with the method, a brief derivative overview follows–but it is recommended that you read the original documents previously referred to.
Runoff Reduction Method Overview
The RRM begins by stating an annual percent rainfall volume capture goal. For example, in the Chesapeake region, the goal is to capture and retain onsite 90% of the AAR (actually it is stated as capturing the 90th-percentile rainfall event). In Nashville, it is proposed to make the goal 80% AAR–which would make it consistent with the current total suspended solids (TSS)-only pollutant capture goal in final result (i.e., 80% average annual runoff volume capture and 100% treatment of that volume equals 80% TSS removal…or so we say.) The RRM then seeks to construct a method to attain this annual removal goal.
How is that done? This is where things begin to get slippery.
The RRM translates the percent AAR to be removed into a “rainfall depth” (P). In many cases, P is taken as one inch. This rainfall depth is used as a parameter under the assumption that capture and treatment of a specific depth will in some way equal meeting an AAR reduction goal. This depth is then converted into a treatment volume through defining an annual average volumetric runoff coefficient (Rv).
Rv is equal to average annual runoff divided by average annual rainfall–annual percent volume removal. Rv is not applicable, except in general concept, to individual storms. There are an infinite number of combinations of factors for a particular storm event that could produce a specific Rv value–but it is a pretty good bet that no small storm would do so, and the largest events would exceed this value every time.
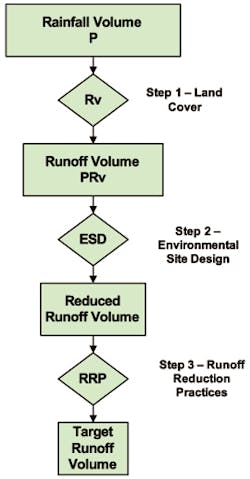
After these basic definitions, the method follows several steps as shown in Figure 1.
Step 1: Reduce Runoff Through Land-Use and Ground Cover Decisions. This step focuses on the “background” land cover and how much of the average annual rainfall it catches and removes from runoff. In this step the RRM computes volumetric runoff coefficients (Rv) categorically detailed enough to span the range of land use and Hydrologic Soil Group (HSG) combinations (including impervious cover).
Design activities in step 1 focus on impervious area minimization, reduced soil disturbance, forest preservation, etc. The goal is to minimize impervious cover and mass site grading and to maximize the retention of forest and vegetative cover, natural areas, and undisturbed soils, especially those most conducive to landscape-scale infiltration.
If volume is important, versus percent annual rainfall removal, then the step could optionally be completed by multiplying the area-weighted Rv by the chosen rainfall depth to obtain a new, lesser runoff depth: P*Rv. If this is multiplied by the site area (A), then a volume could be obtained. However, it should be understood that P and Rv have specific definitions that are not storm specific but are
Step 2: Apply Environmental Site Design Practices. If the target AAR reduction has not been attained, then step 2 is required. This step focuses on implementing environmental site design (ESD) practices during the early phases of site layout. In this step, the designer enhances the ability of the background land cover to reduce runoff volume through the planned and engineered use of such practices as disconnection of impervious areas (e.g., rooftops) to sheet flow, amended soils, pervious pavers, and planned reforestation. Each of these practices is assigned an ability to reduce rainfall coming to it on an average annual basis, and this assignment is conveniently captured in the Rv factor (a simple ratio of average annual runoff to average annual rainfall).
For example, you can reduce Rv of a rooftop by 25% if you send its runoff to turf grass (C/D soils), but by an additional 25% if you send its runoff to amended soils (along with other associated loophole-closing criteria).
If volume is important, versus percent annual rainfall removal, then the step could optionally be completed by multiplying the adjusted area-weighted Rv by the chosen rainfall depth to obtain a new, even lesser runoff depth: P*Rv’.
Step 3: Apply Runoff Reduction Practices (RRPs). If the target AAR reduction has not been attained, then step 3 is required. In this step, the designer experiments with combinations of green infrastructure (GI) RRPs on the site. In each case, the designer estimates the area to be treated by each RRP to incrementally meet the overall average annual reduction goal. Such engineered practices as infiltration, bioretention, green roofs, tree planters, and rainwater harvesting are envisioned. Design and sizing standards can then be created for each of these RRPs to ensure their ability to meet some required AAR percent runoff removal.
This is the step where volume comes back into play, but not in the way most designers use it. The guidance for the effectiveness of the various RRPs is expressed in terms of percent annual volume reduction, not volume reduction. For example, for bioretention design, if the media + ponding volume equals Rv*A, 40% runoff reduction is assigned. If it equals 1.25 Rv*A (plus some other changes), 80% runoff reduction is assigned. But there is a gap between the RRP sizing and the actual runoff reduction assigned–at least in the mentioned guidance they are related but not calculated.
At the end of step 3, the designer must have achieved the required AAR reduction percent. If the target is not reached, the designer can select additional, conventional best management practices (BMPs)–such as filtering practices, wet ponds, and stormwater wetlands–to meet the remaining percent reduction requirement through a transmutation of pollutant removal to volume removal. This is essentially the fallback position of the Tennessee permit and in most of the expressions of the method elsewhere.
Other fallback positions include the ability to provide the required volume offsite (but not off-watershed) or to pay up: a fee-in-lieu that will surely be used by the local government to accomplish what the designer could not.
Issue 1: Dealing With Inconsistencies in Application of the RRM
The RRM has been accepted at face value by a number of local governments who then have found that its application can lead to some confusion and a few logic-based difficulties. I want to be quick to point out that the logic breakdown is not necessarily inherent within the method itself but in some versions of the description of the method, local understanding, and design application.
The stated goal of the method is to capture and treat a predetermined percentage of the AAR. The idea is “if I can retain onsite this annual percentage, then I can attain a specific pollution reduction standard.” Note that this singular goal is not the same as, or equivalent to, the following:
- mimicking the predevelopment hydrology,
- meeting combined sewer overflow long-term control plan objectives,
- capturing the first one inch of rainfall depth for a specific storm, or
- replenishing groundwater reserves.
The most direct and clean way (setting aside complex continuous simulation modeling of the site) to meet an annual percent capture objective is to assign an annual percent removal rating (e.g., Rv=60%) for various land uses and RRP combinations. Then, through an area-weighted application of these percentages, a site designer can attain the standard. (The values assigned to Rv could be estimated through some combination of monitoring typical designs in the field, relying on the experience of long-term practitioners, running laboratory-type experiments, and continuous simulation modeling. To the extent data are available, this is what has been done in the documents referenced for their respective regions.)
That is not what most practitioners of the RRM do. In most cases, the RRM approach taken 1) converts the AAR percent capture into a rainfall depth, 2) then a runoff volume, and then 3) a treatment volume. As stated in some of the background documents, the “treatment volume” is the “common currency” looked at in all steps. That is, a runoff volume is stated as a design criterion (e.g., the one-inch criterion), and this volume needs to be handled by the three steps.
Several areas of confusion emerge when this A=B=C approach is applied:
Is the rainfall depth chosen and as applied really equivalent to a target annual percent capture of rainfall?
How is the 1 inch applied to other land uses that may remove significant rainfall on an annual basis but cannot even come close to one inch on a per-storm basis?
How is the 1-inch standard to be applied in design of stormwater structures (what does “1 inch” mean?) when the real goal is annual percent capture, yet the standard seems to be a per-storm standard?
Treatment Depth/Volume. Within the method, to meet the AAR capture goal a depth is chosen that purportedly captures a certain percent of the annual rainfall. This is good in theory but can be inaccurate in practice. The Tennessee addition of a 72-hour inter-event dry period (IEDP) adds additional opportunities for stumping.
The legitimate question of whether one inch, the 95% storm, or any static depth criterion is the best choice for design is better discussed in a previous article, “Green Infrastructure and Storm Depth Retention Criteria” (Reese, Jawdy, and Parker 2010) and will mostly be avoided here.
For Nashville, we looked at looked at several interpretations of these criteria in an effort to understand any potential shortfalls in the design interpretation of the criteria. If one gets away from continuous simulation of rainfall and runoff, then there is a need to break an intermittent stream of rainfall into storms and apply the capture depth to each storm. Then it is incumbent on the designer to be able to physically accomplish this rainfall capture feat.
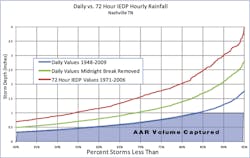
We looked at three interpretations of the criterion: 1) each day is a storm (the USEPA approach), 2) a break in a stream of daily rainfall values signals a storm end, and 3) 72 hours of no rainfall equals a storm ending (the Tennessee criterion). Figure 2 illustrates the concepts.
Each Day is a Storm. The standard “EPA way” to do the analysis is to take daily rainfall values, order them low to high, remove all that are 0.1 inch and less, and then plot them from zero to 100%, the 100% value being the largest daily rainfall recorded (USEPA 2009). Each day in which there was qualifying rainfall is assigned a number: 1, 2, 3, and so on. For Nashville, the 1-inch depth matches closely the storm for which 80% of all storm numbers are less. That is, out of 4,702 qualifying daily rainfall events, number 3,762 is about an inch … and 3,762/4,702 is 0.8, or 80%. (For Nashville, it’s actually storm number 3,921 or 83% of the storms.)
Breaks in Daily Rainfall Equals Storm End. Daily rainfall values have an artificial break at midnight each day. When storms that span across midnight are combined into one storm, the total number of qualifying storms goes down, the average depth storms goes up, and the one-inch storm is actually the 69% storm, not the 80% storm. The 80% storm is actually 1.39 inches.
72 Hours of No Rainfall Equals a Storm End. If we meet the letter of the law and combine our storms such that it takes 72 hours of dry weather before a new storm can be thought of beginning (that is, the total volume of the practice needs to be available a least 72 hours after the end of rainfall), then the number of storms for the period of record goes way down (though we used a slightly different period for which we had hourly data), and the 1-inch storm is actually the 54% storm, not the 80% storm. The 80% storm is actually 2.02 inches.
Figure 2 shows these three approaches plotted using the standard configuration. The shaded portions are the volumes of AAR captured using the selected criterion; each upper one includes those below in its volume captured. So, for example, the green+blue shading shows the capture volume for the case where the daily rainfall values are grouped unless there is a break in the date–signaling the end of a storm event.
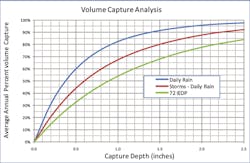
From Figure 2, it is unclear which criterion is “best” from a volume capture basis, so Figure 3 has been constructed to show the actual AAR volume captured under each of the three approaches. From Figure 3, looking at the 1-inch capture criterion and running your eyes vertically up from the 1-inch value on the horizontal axis, it is immediately apparent that the daily rainfall method–that of capturing the lesser of 1 inch or the total daily rain for each day it rains–captures more of the AAR (83%) than the other two cases (72% and 57%, respectively), and that number is pretty close to 80%.
The point of confusion is, of course, that the method is targeting an annual percentage of total rainfall, not a specific storm depth. The translation of the annual percent capture objective to a storm depth is significantly dependent on how the storms are defined and leads inevitably to confusion when someone is actually sizing a control: “Do I size it for a certain capture percentage, or do I size it for a certain capture volume?” Sizing for 1 inch, depending on the specifics of the criteria, may not match the expected annual capture.
So the application of the criterion may be internally inconsistent with good science and sound practice, and causes some confusion when a designer is attempting to size a GI practice. But if I could, in fact, know that I am capturing, on average, at least one inch per day of rainfall, then I would be at about 80% AAR capture, at least in Nashville. That’s funny. (See the quote at the beginning of the article to get the joke.)
How do I design for that?
Hold that thought.
“Kerplunk” Design and Local Analysis. A centerpiece of the RRM and all volume-based methods is the use of soil or gravel media storage and parent soil infiltration to remove volume. A significant issue, given the “one-inch” standard above, is the proper sizing criteria to use for the media portion of permeable paving, infiltration trenches, tree planters, and bioretention. In each case, the normal practice of most practitioners using the RRM (though never stated in the RRM writeup) is to use the “kerplunk” method of sizing. That is, “we assume the runoff from the one-inch storm is “˜kerplunked’ into the RRP.” (I do not know where the term was first coined, but I suspect beer was involved and figure there are plenty of known suspects on that score.)
When one is sizing a control that has media storage in RRM design, the objective is to size it to handle some known AAR volume reduction. Thus to size it for a particular runoff volume–P*Rv*A–is to take a leap of faith that that volume somehow accurately reflects the right annual percent volume reduction.
Kerplunk design has two seemingly counterintuitive characteristics: Storm timing is not considered, and neither is antecedent soil moisture. These assumptions seem very questionable, the first being conservative and the second non-conservative with respect to the ultimate size of the control. But when you look at them in tandem, you end up saying, “That’s funny!” Let me illustrate with our Nashville analysis.
Timing Issues. The timing of the inflow into the practice is ignored; it is assumed the required treatment depth/volume (P*Rv*A) appears instantaneously within the practice. Infiltration out the bottom of the infiltration device is also ignored. Flow is instantaneously in, and nothing gets out. Timing and storm characteristics are ignored.
This assumption would certainly cause significant overdesign in a normal design approach because, for example, the median time to accumulate 1 inch in Nashville for 101 analyzed storms over an inch is 40 hours. Even if we pick the fastest accumulation time for the top 20% of the storms (sort of matching the 80% idea), it still takes 12 hours of rainfall on average to get to 1 inch. Assuming the infiltration rate is the constriction point and is 0.5 inch per hour (a typical lower allowable limit), over 12 hours you are ignoring about a half-foot of infiltration–at a minimum.
Soil Moisture Issues. Secondly, and in the opposite direction, the total storage capacity of the control is assumed to be available at the beginning of every storm–the porosity plus ponding value. That is, the facility is assumed to be completely dry just before each and every storm.
This assumption would cause significant underdesign because it is non-conservative. The storage volume available in media-based designs in humid and semi-humid climates (everything except the arid Southwest) is never the soil porosity. When these RRPs dry out from a saturated point, they drain by gravity in a day or so to the “field capacity”, and then by evapotranspiration in a week or so to the “permanent wilting point.” For Nashville’s bioretention mix soil media, porosity is in the 40% voids range; field capacity is in the 25% filled voids range; and permanent wilting point is in the 7% filled voids range. In Nashville, it rains more than 0.1 inch every 5.3 days. For a 2- to 3-foot media depth, this assumption means you design for a half-foot of void space more than you actually have.
You might have noticed that these two assumptions are of the same order of magnitude and in the opposite direction, at least for Nashville weather characteristics. Do these two sets of opposite assumptions have the potential ability to cancel each other? To test this idea, we asked, “Does “˜kerplunk’ sizing reflect an appropriate sizing strategy for Nashville?”
Three different kinds of media-based GI RRPs were designed (bioinfiltration, porous surfaces with gravel beds, and tree planters) using the kerplunk method and then were sized using continuous simulation across a range of infiltration rates to capture 80% of the AAR. We decided to use the 1-inch equals 80% criteria and standard kerplunk design. We compared surface area and water storage requirements for each design approach.
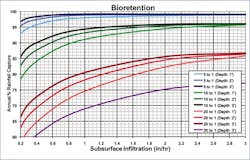
Figure 4 shows typical Nashville-specific modeling output sizing curves for bioretention. The horizontal axis is the parent material infiltration rate and the vertical axis is annual capture percent for the practice. The families of curves reflect three different media depth conditions and four different contributing drainage area (CDA)-to-practice surface area ratios. So, for example, if the designer had a parent material infiltration rate of 1 inch per hour, any configuration along the vertical 1-inch-per-hour line would work, depending on the volume AAR removal rate needed or desired.
How does the design using continuous simulation–including infiltration, Nashville media mix specifications, evaporation from the paved surface, and evapotranspiration for a normal mix of bioretention plantings–compare to the kerplunk design based on competing wrong assumptions and a simple 1-inch * Rv * A calculation?
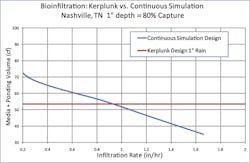
Figure 5 shows the difference in water storage volume (including 6 inches of surface ponding volume) between controls designed using the kerplunk rationale (which is independent of infiltration rate) and those designed using the results of continuous simulation modeling for a series of parent material infiltration rates. Every attempt was made to use comparable dimensions, and all were designed to obtain the 80% annual removal rate based on either the 1-inch rainfall assumption or, in the case of continuous simulation, on actual calculated average annual volume removal.
Plots for pervious surfaces (i.e., pervious pavers, porous pavement) and media dominated by trees follow a similar pattern.
For a range of allowable infiltration rates of about 0.5 to 1.2 inches per hour, in Nashville the continuous simulation results differ from the kerplunk results by less than 15%. Above that infiltration rate, the continuous simulation results show a significantly smaller required facility, and measured infiltration rates in those ranges should probably be recognized as an option.
Given all the other assumptions contained within the design approach, the difference, accidental as it is, between the results of continuous simulation and kerplunk design for the 80% removal target is probably not a good reason to resort to more complex design sizing approaches for those RRPs that rely on storage of runoff within a designed media and parent material infiltration.
That’s funny! Serendipity is a beautiful thing.
Issue 2: Adoption of Local RRM Criteria
The second major area we investigated for Nashville was a comparison of “standard” design criteria and Rv values with those derived from modeling of Nashville climatic, soils, and other conditions (e.g., lots of big yards, bedrock, country music artists being expected to maintain RRPs). There are a number of ways that local consideration and analysis can help verify or modify standard RRM criteria. I have already described Nashville’s adoption of an 80% capture criterion, which just happens to be equal to 1 inch of rainfall using the conventional EPA analysis, and the allowance of kerplunk design for media-based RRPs–at least smaller ones without infiltration testing requirements. Both are simplifications but remain true to the real-world 80% average annual capture goal. The remainder of this article will touch on disconnection of impervious area and cistern sizing though every potential control was tested as appropriate.
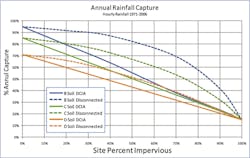
Disconnection. Because Nashville is a city with many parcels with large turf areas, significant work was done looking at the benefits of running flow from impervious areas over grassy areas for the three HSG soil groups present within Davidson County, each with an infiltration rate at the lower end of the spectrum for the subject HSG soil type. The goal was simply to determine the ability of the many Nashville lawns to handle some of the volume from the patchwork of impervious areas. Figure 6 shows continuous simulation modeling results for levels of imperviousness from 0% to 100% for both directly connected impervious areas (DCIA), and for those same areas directed to the remaining grassy areas as sheet flow (disconnected). A moderate slope value was chosen for this analysis, and then sensitivity to slope was tested. Slope was found not to be an issue, if sheet flow can be ensured by stringent flow spreader and terracing criteria.
For example, a 50% impervious site located in B soil would have an overall volume removal rate of 56% with DCIA, but 82% if the impervious areas were sheet-flowed across the grassy area—thus effectively handling the runoff from the site. These values will be merged with general guidance from the RRM documents for local use.
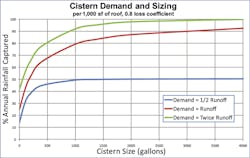
Cisterns. Unlike some other RRPs, cistern design is very site and demand specific. The background documents recommend a 40% volume reduction credit on average. This recommendation was tested to provide more detailed guidance to designers. A series of assessments was performed using both hourly and daily rainfall data. Daily was found to be sufficiently accurate in all cases. Nashville data indicate that on average, a 1,000-square-foot roof will yield about 82 gallons per day of rainfall. However, rainfall is never that evenly spaced.
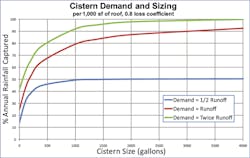
Simulations were run for three conditions to see what cistern size, per 1,000-square-foot rooftop, would be required to capture various percentages of annual runoff—demand equals half runoff, demand equals runoff, and demand is twice runoff—all on a constant basis. Demand at twice the runoff means that demand per 1,000-square-foot rooftop is twice the expected runoff of 65.5 gallons per day (0.8 runoff coefficient), and so on. Figure 7 shows the result.
As can be seen from Figure 7, the curve begins to flatten at 1,000 gallons storage per 1,000 square feet of roof area (for the given demand conditions). When the demand is low, it is easily satisfied with a lot of lost runoff (blue curve). As the demand reaches the average daily runoff, the curve moves slowly upward. As a rule of thumb, one gallon per square foot of roof will meet the 80% RRM goal for average demand equaling average runoff. There is no substitute for daily modeling of demand and rainfall, and such tools are easily developed.
It is doubtful that residential rain barrels should be given the same consideration, and it is recommended that any allowance given for these be based on qualitative objectives—dependent as they are on the drain time being less than 12 hours to achieve even a 30% annual volume removal.
Closing
It is clear that the Runoff Reduction Method is an effective version of the next logical step in the evolution of stormwater management, and that it helps facilitate a transition to a volume-based approach. The authors and developers of the method are to be applauded for their efforts.
However, the method is not without its complexities in interpretation and the potential need to verify it for local conditions. Many of those needing to enforce its provisions do not understand its derivation or limitations.
Knowing this from other projects, our consultant team entered an analysis of the method doubtful of several aspects of the RRM in application to Nashville.
That’s funny. …
…Some of the most troublesome
aspects of normal application of the method seemed to balance themselves out in local application using Nashville data. Two wrongs can make a right. Where they did not balance well, suitable adjustments can be found to support specific circumstances.
Of course, this only deals with technical criteria. In Nashville, institutional issues were also addressed by identifying barriers to GI use through a streamlined EPA Scorecard approach, a set of demonstration projects was initiated, educational initiatives were begun, and a series of incentives and credits was developed to facilitate use.
Such an investigative approach to application of the Runoff Reduction Method is recommended prior to wholesale adoption of this, or any, method. If for no other reason, it will prove to the development community that the method works even if some of it does not make total sense!
References
Chesapeake Stormwater Network. “Technical Support for the Bay-Wide Runoff Reduction Method, Ver. 2.0.” CSN Technical Bulletin No. 4, undated.
Center for Watershed Protection. 2008. “Technical Memorandum: The Runoff Reduction Method.” April 18, 2008.
Reese, Andrew J., Curt M. Jawdy, and Joseph M. Parker. 2010. “Green Infrastructure and Storm Depth Retention Criteria.” Stormwater, July/August 2010.
USEPA. 2009. “Technical Guidance on Implementing the Stormwater Runoff Requirements for Federal Projects under Section 438 of the Energy Independence and Security Act.” EPA 841-B-09-001, December 2009.
