My job consists of working at a desk, mostly sitting. It’s certainly not a physically challenging job, but personally, it can be a little rough on my knees and my back. So, in an attempt to get more active and alleviate some joint pain, I’ve started running (albeit slowly and with lots of encouragement from a runner friend). I like how low-tech running is—once I lace up my shoes, all I need to do is head out my front door.
I have started to notice a difference in my runs as we head into summer, though. Not only have I been adjusting when I run to avoid the hottest parts of the day, but the hills seem so much taller now. My standard route from my apartment is exclusively on sidewalks downtown and includes about 150 feet in elevation change, but I swear it feels like a thousand in the heat.
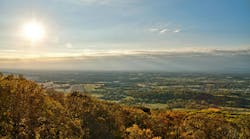
My runner friend suggested I try a run near his house. He lives in a suburban neighborhood where the elevation change is only about 50 feet and there is a beautiful park nearby where you can pause if you spot a red-tailed hawk or a great blue heron. He recommended a route to me that ended in a shady redwood grove. “It’s always several degrees cooler in there,” he said. “It feels great as a cool-down.” He was right—entering the park felt like a well-earned reward after sweating in the California sun.
I know I’m starting to get a theme going on this blog with all this talk of “urban heat islands.” The glass, concrete, and steel of cities trap heat and increase the ambient temperature. Green spaces and infrastructure are generally the recommended remedies to help keep cities cool. I knew all this—I’ve written about it—but ending that run in a park shaded by huge redwoods drove it home. There’s nothing like experiencing something for yourself.
CityLab shared a series of maps from the National Oceanic and Atmospheric Administration (NOAA) and the Trust for Public Land of the urban heat island effect in several East Coast cites ahead of last weekend’s heatwave. Parks, areas near bodies of water, and places where development is less dense are blue, green, or yellow. The urban centers are orange or red, indicating higher temperatures. The maps are a couple of years old, but NOAA reported this week that eight cities across the country will be running urban heat mapping campaigns this summer.
I found myself looking at these maps and plotting where might be the most pleasant for an early morning or evening run, were I to visit any of these cities. But really, heading out to the park for a run isn’t always convenient—one of the things I like about running is that it can start and finish at my doorstep.
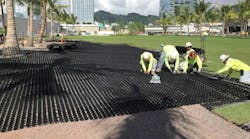
By increasing green infrastructure and green spaces in downtown urban areas, maybe those red and orange areas could turn yellow, or maybe even green. And it isn’t just me that would benefit. According to the EPA, urban heat islands have wide-ranging effects. Urban heat islands increase energy demands for cooling, extreme heat poses health risks to sensitive populations like the elderly and the young, and high pavement and rooftop heat can also increase the temperature of stormwater runoff, which can have negative impacts on aquatic life.
What have your experiences been with urban heat islands? In what kind of applications would you like to see urban heat maps like this used? Please send your thoughts and comments to [email protected]. And if anyone needs me this weekend, I'll be in the park.