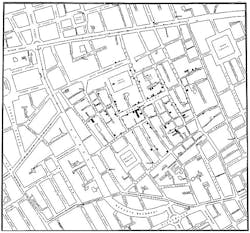
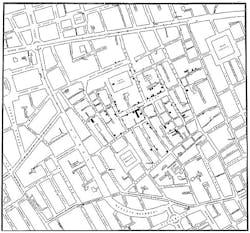
IN 1854, DR. JOHN SNOW mapped the spread of cholera in London’s Soho district. By charting the relationship between illness and location, he was able to determine the source of the disease—contaminated water from a pump on Broad Street—and better understand the illness’ progression. Furthermore, his use of a diagram to illustrate the correlation between cholera cases and contamination source became one of the most notable early examples of geographical analysis.
More recently, Dr. Elijia Stommel, a professor of neurology at Dartmouth’s Geisel School of Medicine, and his team used satellite imagery and geoinformatics to track cyanobacteria and correlate algae blooms to cases of Lou Gehrig’s disease or amyotrophic lateral sclerosis (ALS). When they began mapping ALS patients several years ago, the team found clustering around bodies of water and discovered the concurrence of algae blooms.
Dr. John Snow’s cholera map
Maps offer us an omniscient view. They integrate data streams to yield a multi-layered perspective often crucial for problem solving. As a visual tool, spatial representation offers enhanced understanding by affording us an opportunity to observe contextual relationships. Maps show us: this relates to this, and here’s how.
Today we use an array of advanced technologies to create and analyze maps. Constellations of sensors and databases collect and store data. Geographical Information System (GIS) software integrates data points and translates them into a visual medium, allowing us to explore our observations from a data-enriched vantage point.
Within this issue of Water Efficiency magazine we uncover a myriad of ways in which digital cartography helps water professionals gather big-picture insight, integrate hydrologic information, and coordinate both personnel and processes to manage water resources with increased precision and efficiency.
Maps can illustrate any kind of relationship—of landmarks, layers of the earth, people, or pipes in a system. As we learn in “Innovation Ups Irrigation IQ“, mesh network-based telemetry and three-dimensional ground imaging are exciting geo-spatial advances in irrigation technology that can increase a system’s precision and effectiveness, especially when paired with today’s cutting-edge sprinkler heads, soil moisture sensors, and wireless controls.
In “The Winning Combination” we investigate ways in which GIS, paired with automatic metering technology, helps municipalities create a consolidated, multi-layered view of their assets, distribution systems, maintenance records, and personnel. We see how this holistic perspective can often translate into heightened utility efficiency and remarkable cost savings.
Acoustic leak detection can also help utilities save money by locating points of outflow. In “Acoustic Leak Detection Stems Water Loss” we learn that by emitting low-level sounds, these systems create sonic maps that identify problematic areas. The technology not only saves water, but also reduces service interruptions, and conserves utility resources.
In “Technology Transforms St. Johns County” we get a first-hand glimpse of a municipality’s experience implementing a GIS platform that has not only helped the utility’s departments collaborate seamlessly, but has also facilitated the evaluation of its aging infrastructure and the prioritization of equipment replacement.
From detecting water loss in a distribution system, to mapping and tracking asset maintenance, work force coordination, and integrating utility systems, digital mapping tools and the perspective that they provide increase our understanding of our water resources, our utility systems, and distribution matrices. As a result, we’re able to manage water in smarter, more sophisticated ways.
How does geographic analysis support your organization?


