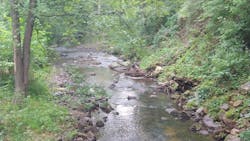
Pheasant Branch is a tributary to Lake Mendota in Dane County in south-central Wisconsin. Much of its 24.5 square-mile watershed is within Middleton. The upper part of the watershed consists of the North Fork Pheasant Branch basin (11.51 square miles) and the South Fork Pheasant Branch basin (6.2 square miles). Land use in the North Fork basin is mainly agricultural, while the South Fork basin is about 80 percent urbanized with commercial and residential development. The Pheasant Branch watershed has been rapidly urbanizing, from a population of 8,266 in 1970 to over 21,000 in 2020.
The purpose of this study is to show the effectiveness of Middleton’s stormwater-management program for water years 1975-2020. The study analyzes stream-flow and water quality data on Pheasant Branch, the major drainage in Middleton. The study then explores how the streamflow and water quality characteristics were affected by both climate change and urbanization.
The City’s Actions
In the early 1970s, the city of Middleton was concerned about the possible negative effects of urbanization and of increased channel erosion in Pheasant Branch. The city was also concerned with the sediment and phosphorus load into Lake Mendota, which suffers extensive algal blooms every year, limiting the recreational opportunities in this important resource.
To address these concerns, the city formed the Middleton Water Resources Management Commission (WRMC) in 1974 to protect and enhance the water resources of Middleton. One of the first actions of WRMC was the development of a stormwater runoff control ordinance in 1979, which aimed to prevent development from increasing flood peaks due to increased impervious areas. The ordinance was modified several times to address phosphorus and sediment loading into Lake Mendota and loss of recharge to the groundwater system.
Since the ordinance was enacted, more than 160 structural stormwater management facilities have been constructed. The largest is the Confluence Pond, located at the confluence of the North and South Forks of Pheasant Branch, which was built in 2002. In addition, Middleton became a participant in Yahara WINS, which is an adaptive management program administered by the Madison Metropolitan Sewage District to reduce phosphorus loads.
Another important action was the establishment of a streamflow and water quality monitoring program with the U.S. Geological Survey (USGS). Data collection on the mainstem of Pheasant Branch has been conducted since 1975 and on the South and North Forks for two periods, 1978-1981 and 2012-2020.
The monitoring program has provided Middleton with 46 years of data. Few other long-term data sets are available for evaluating the effects of urban stormwater-management practices, as well as evaluating the effects of urbanization and climate change.
Increasing Streamflow
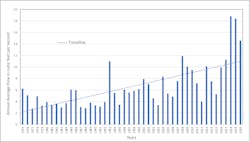
Over the 46-year period, streamflow characteristics have increased significantly at the mainstem Pheasant Branch’s Parmenter Street gaging station. The large increases in annual average streamflow and annual flood peaks are shown in Fig. 1. This increase has a major impact on stormwater management practices and on the evaluation of the effectiveness of practices. The large increase is in part due to the increase in precipitation from climate change as well as rapid urbanization in the South Fork Pheasant Branch.
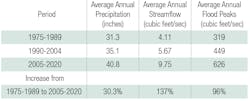
Hydrologists found an abrupt change in the relationship between precipitation and streamflow after 1992.1,2 In order to highlight the changes in annual precipitation, streamflow and flood peaks, the period of record for 1975-2020 at the Parmenter Street gaging station was subdivided into three periods: 1975-1989, 1990-2004 and 2005-2020.
The changes that occurred from the beginning period, 1975-1989, compared to 2004-2020, are shown in Table 1. As shown, the average annual precipitation increased 30 percent, average annual flow increased 137 percent and average annual flood peaks increased 96 percent. The 100-year flood frequency at this station calculated by USGS was 1,140 cubic ft/sec in 1992, while in 2020 the 100-year flood was calculated to be 2,100 cubic ft/sec — an increase of 84 percent.
Success in Decreasing Sediment and Phosphorus
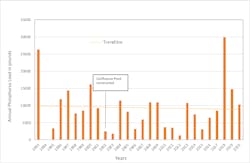
In spite of the increased annual streamflow and flood peaks, the city’s stormwater management practices have been successful in decreasing the sediment and phosphorus loads to Lake Mendota from Pheasant Branch. The decrease in annual phosphorus loads that were monitored at the Pheasant Branch Parmenter Street gaging station from 1993-2020, and shown in Fig. 2.
The biggest decrease in sediment and phosphorus loads occurred after 2002, when the Confluence Pond facility began its operation. Since then, the annual sediment load average observed has decreased from 2,300 tons per year to 1,000 tons per year for a decrease of 56 percent. The annual phosphorus load average has decreased from 12,200 pounds per year to 6,300 pounds per year for a 48 percent decrease.
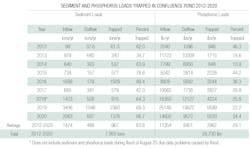
To better understand trapping efficiency and streamflow quality from the two forks of Pheasant Branch, streamflow and water quality gaging stations were established on both forks. An analysis of the inflow and outflow data from the three gaging stations for the period 2012-2020 (Table 2) shows that the Confluence Pond trapped 64 percent of the sediment load and 29 percent of the phosphorus load.
For the period 2012-2020, the total sediment load trapped was 7,950 tons and the total phosphorus load trapped was 26,700 pounds. Since Confluence Pond was built in 2002, it’s estimated that the Confluence Pond trapped 15,900 tons of sediment and 53,300 pounds of phosphorus — thus achieving a significant reduction in the loads from Pheasant Branch into Lake Mendota.
The Effects of Climate Change and Urbanization
To evaluate the effects of climate change and urbanization, a comparison was made from the streamflow data available for the three gaging stations during the two periods of 1978-1981 and 2012-2020. During the 1978-1981 period, the South Fork had just started to urbanize while the North Fork was completely agricultural. For the 2012-2020 period, the South Fork was almost completely urbanized while the North Fork remained almost entirely agricultural.
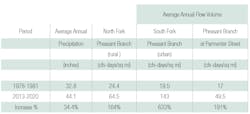
A comparison of the two periods in Table 3 indicates that the average annual flow volume on the North Fork increased 164 percent, attributed to increased precipitation due to climate change, while the average annual flow volume on the South Fork increased 633 percent, most likely attributed to be the result of both climate change and urbanization.
A similar comparison of annual flood peaks shows that the flood peaks increased 126 percent on the North Fork and 532 percent on the South Fork. Again, the data shows a much larger increase on the South Fork due to the combination of climate change and urbanization.
In addition to the effects of climate change, the analysis of stormwater management practices was further complicated by an extremely large flood in August 2018, when 10-15 inches of rain resulted in a flood peak of 3,100 cubic ft/sec at the Pheasant Branch at Parmenter Street gaging station. The flood peak was estimated by USGS to be greater than the 500-year recurrence interval. The storm produced very large sediment and phosphorus loads that masked a lot of the progress in reducing these levels.
The Value of Data
The study shows that Middleton’s stormwater management program was very effective in reducing sediment and phosphorus loads, even with urbanization and increased precipitation from climate change. Unfortunately, flood peaks still increased substantially.
This study illustrates the importance of long-term streamflow and water quality monitoring. Without this 46-year dataset, Middleton would not be able to determine if the stormwater management program was working, nor would they be able to separate the effects of urbanization from climate change.
The value of the long-term streamflow data set was also shown when Middleton decided to update the existing floodplain mapping due to the 2018 flood and the increasing trend in the estimated 100-year flood. A floodplain mapping study was done by MARS-EOR Consultants in 2020.
The extensive streamflow data from the three gaging stations allowed a well-calibrated rainfall runoff model to be developed. Using the NOAA 12-hour 100-year rainfall, adjusted for the effects of climate change the model produced an estimated 100-year flood at the gaging station of 2,100 cubic ft/sec, compared to the USGS-calculated analysis of 2050 cubic feet/sec.3 The rainfall runoff model also showed that Confluence Pond reduced the 100-year flood by 36 percent from 3300 cubic feet/sec to 2100 cubic feet/sec.
With the help of the long-term data set, Middleton will be able concentrate future stormwater management efforts more effectively. The analysis shows that to control or reduce flood peaks in the future, more stringent flood peak controls will be required, especially on the North Fork as it urbanizes. In addition, continued effort should be made within the South Fork basin to look for opportunities to retrofit some of the existing development with flood control measures.
The data also shows that to further reduce phosphorus loads, efforts should be focused on the North Fork watershed where manure spreading and other agricultural practices have produced large phosphorus loads. Presently, Yahara WINS has been working with the farming community in the North Fork watershed in implementation of phosphorus reduction strategies. Middleton should also prepare for continued channel erosion and structural damage to the trails and bridges along Pheasant Branch, due to the increasing trend of precipitation as a result of climate change. SW
About the Author: Warren A Gebert has worked for 42 years as a hydrologist and civil engineer with USGS’s Water Resource Division and with the U.S. Bureau of Reclamation. Presently, Gebert acts as Chairman of the Middleton Water Resource Management Commission and as Scientist Emeritus with USGS.
Sources:
1. Gebert, W.A., Garn, H.S. and Rose, J. R. 2012. "Evaluation of the effects of city of Middleton Stormwater-Management Practices on streamflow and water-quality characteristics of Pheasant Branch," Dane County, Wi., 1975-2008. US Department of the Interior, US Geological Survey.
2. McCabe, G.J. and Wolock, D.M. 2002. “A step increase in streamflow in the conterminous United States.” Geophysical Research Letters 29, no. 24: 38-1.
3. Wright, D.B., Ricardo Mantilla, and Christa D. Peters-Lidard. 2017. “A Remote Sensing-Based Tool for Assessing Rainfall-Driven Hazards.” Environmental Modelling & Software 90: 34–54.
Published in Stormwater magazine, November 2021.
