In 2011, the US Army launched its Net Zero Initiative, aiming for all Army installations to be net zero in water, energy, and waste by 2050 (Foster 2011, Lopez 2012). To help achieve this goal by aiding in the selection of sustainability technologies at Army installations for on-post use, the authors developed a Macros-embedded, Excel-based decision support tool—herein referred to as the dashboard—for US Army Installation Management Command (IMCOM). IMCOM is in charge of the day-to-day operations at army installations domestically and abroad, including that of dining facilities.
Typically, technology selection at Army installations is performed by installation personnel without much guidance. Unstructured decision making such as this often unintentionally includes cognitive biases (e.g., confirmation bias, repetition bias), and can result in an overemphasis on one or more selection elements such as cost (Oswald et al. 2004, Kahneman, 2011).
The dashboard uses multi-criteria decision analysis (MCDA) to quantitatively evaluate different technologies over a range of objectives, criteria, and metrics identified by IMCOM and weighed to reflect their importance relative to IMCOM’s Net Zero goals (Belton and Stewart 2002, Foster 2011).
The dashboard’s initial application was for food waste management technology selection for on-post use. Fourteen different technology makes and models were selected by IMCOM for analysis, including dehydrators, pulpers, garbage disposals, containerized in-vessel composting, windrow composting, forced-air static composting, and a containerized anaerobic digestion (AD) system. For installations and sites that have limited land resources or are otherwise severely constrained, there exist other models and resources for food waste management guidance which consider off-post alternatives, such as the US Army ERDC technical report “Organic Waste Diversion Guidance for US Army Installations” (Fey 2016).
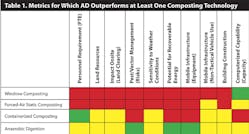
Unlike other MCDA tools, the dashboard also uses these same metrics to capture the capabilities and limitations of a specific installation to implement a technology. For each metric there exist different levels of resource requirement or associated consequences. Installation personnel are interviewed to elicit the installation’s ability to accommodate these consequences or levels of resource requirement. The installation’s ability to accommodate these consequences and levels of resource requirement are reflected by the development of green, yellow, and red range for each metric (as shown in Table 1). Respectively, the green, yellow, and red ranges signify a certain level of resource or associated consequence is acceptable, acceptable with some difficulty, or unacceptable.
The dashboard calculates an MCDA score for each technology using the technology performance evaluations and weightings, and determines the percentage of the score that falls into each color range. The dashboard can be easily rerun to reveal the effect of changes to an installation’s capabilities and limitations, the priorities of the overarching organization, or the performance of a technology.
The dashboard’s creation and application to Fort Hood, TX is outlined in “Decision Support for Selection of Food Waste Technologies at Military Installations,” which is under review in the
Journal of Cleaner Production (Chadderton et al. 2016).
In its previous application at Fort Hood and on three scenario installations used as a sensitivity analysis of the dashboard’s weights, the dashboard’s results had AD performing poorly relative to the windrow composting, forced-air composting, and containerized composting technologies, in terms of their appropriateness for the installation.
Since AD, like composting, offers the ability to reuse and transform organic waste into a new product for beneficial use in addition to diverting it from a landfill, the difference in performance of these technologies came as a surprise. The results of this previous dashboard application inspired the experimental research question at the center of this report: Under what circumstances would AD be the optimal choice for an installation?
Methods
Case Study. The selection of an AD technology for an installation was illustrated by comparing one model of an AD technology against one model each of a containerized composting technology, a windrow composting technology, and a forced-air static composting technology.
Weights. The weights for the dashboard used for this case study were set the same as for the previous application of the dashboard at Fort Hood. The weights were set by the authors to reflect the Army’s net zero goals using a modified “SMARTER” (Simple Multi-Attribute Rating Technique Exploiting Ranks) approach (Edwards and Barron 1994), which is a swing-weighting approach that maintains the ratios of importance between metrics. Equal weighting among metrics is allowed, as are weights of zero, as weights are normalized to sum to 100%. Of the 55 metrics used to evaluate each technology, 13 each individually accounted for 4% or more of the total score, and thus “drive” the model. Collectively, these 13 metrics account for almost 70% of the total score.
Capabilities and Limitations of Hypothetical Installation. To answer the research question of this case study and determine the factors that would lead to AD being the most optimal technology for an installation, a hypothetical “Pro-AD” installation was developed, where AD was set to be the most preferred technology.
To create this scenario, the installation’s capabilities and limitations were set, so that 0% of the AD technology’s MCDA score fell into the red range. For every metric, any performance by the composting technologies worse than that of the AD technology was deemed unacceptable and fell into the red range. As an example, the model of AD system evaluated for this experiment requires 1.5 full-time equivalents (FTE) to operate the technology, and so 1.5 FTE is listed for AD under the Personnel Requirement (FTE) metric.
Therefore, the Pro-AD installation can accommodate a technology that requires up to 1.5 FTE for its operation, and the percentage of the total score for this metric would fall into the green range as long as the FTE required is less than or equal to 1.5. For any technology with a higher FTE requirement, e.g., 2 FTE, the installation would not be able to accommodate that FTE requirement and the percentage of the total score for this metric for that technology would fall into the red range.
Variation of Land Availability and Food Waste Processing Volume Parameters. AD’s performance against composting was additionally observed while simultaneously varying two parameters: acreage availability and the volume of food waste processed. The acreage parameter compared an installation’s ability to process food waste with 1 acre and 10 acres, reflecting a land constrained and non-land constrained installation.
The second parameter allowed for the analysis of each technology’s suitability to the installation depending on the installation’s need to process 25%, 50%, 75%, or 100% of the 1,500 tons of food waste it generated annually.
Analyzing AD’s Outperformance of Composting Technologies. AD’s outperformance of the composting technologies was analyzed in four ways: The first analysis determined the metrics where AD outperformed at least one of the composting technologies. The second analysis evaluated the number of units of each technology required by an installation per percentage of food waste processed and acreage available.
The third analysis examined the installations annual electricity cost for operating the technologies per percentage of food waste processed and acreage available. The fourth analysis scrutinized the percentage each technology’s score that fell into the red range and how that percentage changed as the percentage of food waste processed and acreage availability varied.
Results and Discussion
Where Does AD Outperform Composting?
The first analysis of AD versus the composting technologies determined the metrics where AD outperformed at least one of the composting technologies; meaning, AD provided to the installation a benefit greater than or burden less than at least one composting technology.
As shown in Table 1, AD outperforms at least one of the three composting technologies on 10 of the 55 metrics evaluated in the dashboard. Due to use of the swing weighting system mentioned above, two of these metrics, Land Resources and Potential for Recoverable Energy, each individually account for 6.5% of the dashboard’s total score, and collectively the 10 metrics account for 17.61% of the dashboard’s total score. These 10 metrics were used, in part, to determine the capabilities for the Pro-AD installation. (Note: AD performed equal to that of each composting technology on nine metrics, preformed equal to at least one composting technology and was outperformed by the others on seven metrics, and was outperformed by each of the composting technologies on 13 metrics. For three metrics, the performance of AD relative to the composting technologies varied depending on land availability and volume of food waste processed. Thirteen of the dashboard’s metrics were left unweighted. These breakdowns represent 17.61, 19.34, 7.34, 39.61, 16.10, and 0.00% of the dashboard’s total score, respectively.)
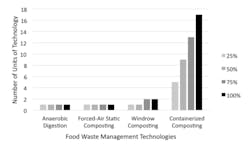
Number of Units Required As Volume of Food Waste Processed Increases. The second analysis of AD versus the composting technologies determined the number of units of each technology required to process the food waste generated annually by the installation. Table 2 shows the throughput per technology depending on the installations acreage availability.
As shown in Table 2, the throughput for windrow composting and forced-air composting is a function of tons per acre per year. For these technologies, one unit would use all the land available to the installation. Contrarily, the containerized composting and AD technologies have a unit-based throughput of 500 pounds per day and 5000 tons per year, respectively. The AD model used in this case study was selected by the author’s client IMCOM for the previous dashboard application.
Figure 1 shows the number of units of each technology required by an installation with 1 acre of land available as the percentage of food waste processed by the installation varies. As shown, when processing 75% or more of the installation’s 1,500 tons of annual food waste, two units of the windrow composting technology would be required. Since one unit of windrow composting already uses all of an installation’s available acreage, having a second unit of this technologies is not possible. The dashboard assumes the dimensions of the windrow would be held constant, whereas in reality an installation would want to consider increasing the volume of its compost rows before looking for additional acreage to expand the composting site. As the percentage of food waste processed by the installation increases, the number of containerized composting units needed increases incrementally due to the small throughput of the model evaluated.
The footprint of the containerized composting units are 100 square feet per unit, so even 17 containerized composting units would fit within 1 acre with enough room for equipment, such as a front loader, to move around. The dashboard assumes that if an installation is processing a higher volume of waste, additional units of the same-sized containerized composter would be used to meet the increased demand. In reality, an installation would likely use a larger capacity containerized composter, and would therefore need a fewer units of the technology. The capacity of the AD model and forced-air static composting technology evaluated for this research can each accommodate 100% of the installation’s annual food waste.
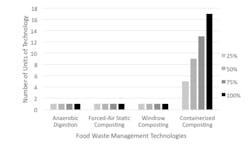
Figure 2 shows the number of units of each technology required by an installation with 10 acres of land available as the percentage of food waste processed by the installation varies. With 10 acres of land, one unit of the windrow composting technology is capable of processing up to 100% of the installations annual food waste. Since the throughputs are unit-based for the containerized composting and AD technologies, the number of required units of these technologies is independent of acreage.
What’s the Energy
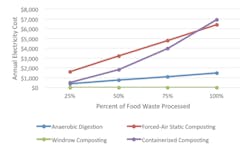
Situation As Volume of Food Waste Processed Increases? The third analysis of AD versus the composting technologies examined the annual cost of electricity required by the units of each technology to operate. Figure 3 shows the annual electricity costs for the four technologies as the percentage of food waste that the installation is processing varies for an installation with 1 or 10 acres of land available. Annual electricity costs were calculated using the kilowatt-hours per ton processed for each technology listed by each technology manufacturer, and multiplying that by the number of tons processed by the installation and an estimated electricity price of eight cents per kilowatt-hour.
As Figure 3 shows, the annual electricity costs for the technologies are independent of acreage. The annual electricity costs for the AD and forced-air composting technologies increase linearly, with AD increasing more gradually than forced-air composting. Containerized composting’s annual electricity costs increase incrementally as more units of the technology are required to process an increasing percentage of the installations food waste.
The need for additional units of windrow composting cannot be visualized, as windrow composting is assumed to not require electricity and instead to use gasoline-powered windrow turners to mechanically turn the compost rows. At higher volumes of waste processing, it is clear that AD outperforms the forced-air static composting and containerized composting technologies in terms of annual electricity cost.
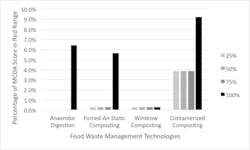
Percentage of Score in Red Range. The fourth and final analysis of AD versus the composting technologies scrutinized the percentage each technology’s MCDA score that fell into the red range. The red range signifies that a certain level of resource or consequence associated with a metric is unacceptable. The lower the percentage of a technology’s MCDA score in the red range, the more likely an installation would be able to accommodate that technology.
Figure 4 shows the percentage of the MCDA score in the red range for the four technologies as the percentage of food waste that the installation is processing varies for an installation with 1 or 10 acres of land available. The red range score for the composting technologies comes from the 10 metrics but does not consider the per 10 metrics.
The percentage of each technologies’ score in the red range is independent of acreage. At 100% processing of the installation’s food waste, the AD, forced-air static composting, and containerized composting technologies each have a higher percentage of their score in the red range. For the AD technology, this is explained by the evaluated model’s ability to reduce only 95% of waste, with the residual material still requiring disposal.
At 100% processing of the installation’s food waste the forced-air composting and containerized composting technologies, the increased electricity costs that accompany processing an increased volume of waste exceeded the hypothetical installations set capability to accommodate costs between $2,000 and $5,000 if necessary (yellow range), so the percentage of the total MCDA score associated with this metric falls into the red range. For the forced-air static composting and windrow composting technologies, the 0.3 percentage of MCDA score in the red range stems from the dashboard’s Building Construction metric, which assumes the composting site will require one or more buildings for miscellaneous composting activities and/or associated operations. The low throughput per unit of the containerized composting technology is responsible for the almost 4% of its MCDA score that is in the red range independent of the percent processing of the installation’s food waste.
Discussion
While hypothetical, the Pro-AD installation in this case study demonstrated some of the more burdensome aspects of an AD system which an installation might need to accommodate, and some capability limitations it might need to possess for an AD system to be preferable over windrow composting, forced-air composting, or containerized composting. The aspects of an AD system which an installation might need to accommodate include the hazards associated with produced biogas, high costs (e.g., capital, operations and maintenance), permits (e.g., air quality, environmental impact), food waste pre-processing, residual material post-processing (i.e., turning solid digestate into compost), some potable water requirement, and a moderate risk from effluent (i.e., liquid digestate with high concentrations of ammonia and salts).
The capability limitations of an installation that would favor AD’s selection over a composting technology include: personnel hiring constraints of 1.5 FTE, limited land resources (i.e., less than half an acre), a need for a containerized technology (e.g., for pest management or climate reasons), and a limited budget for infrastructure purchases (e.g., annual electricity costs, equipment and vehicles, building construction). These burdensome aspects and capability limitations are embodied in the dashboard as metrics.
Conclusion
The case study presented in this article compared the electricity consumption, number of required technology units of AD, and three composting technologies as land availability and the volume of food waste processed varied, showing that under certain scenarios AD can outperform composting technology alternatives. Analysis of the four technologies on a metric basis, however, showed that despite the distinct benefits that AD possesses over composting technologies, such as the potential for energy generation, to successfully implement AD an installation must be able to accommodate certain burdensome aspects and have certain capability limitations.
Nonetheless, this case study has shown that under the right circumstances an installation can be “Pro-AD.” The strengths of AD and the obstacles it faces in its implementation at Army installations hold true for other potential implementation sites such as at Universities. AD can become more desirable for a site if the benefits of AD became more desirable, thereby changing the weighting of the dashboard’s metrics, or if AD technology performance advances such that some of its more burdensome aspects are more readily accommodated by the installation. The authors foresee opportunities for future research in evaluating different kinds of AD systems with the dashboard, and uncovering the reasons for the selection of AD over composting technology alternatives at sites where AD has already been implemented.
Acknowledgement
This study was funded by the US Army Installation Management Command (IMCOM), and permission was granted by USACE to publish this material. The authors would like to thank the technology manufacturers for the assessment data they have provided. The views and opinions expressed in this paper are those of the individual authors and not those of the US Army, IMCOM, US Army Engineer Research and Development Center, or other sponsor organizations.
References
Allen, J. and W. Bakx. 2006. “Increasing Feedstock Throughput On a Smaller Footprint: Analysis of windrows and aerated trapezoidal piles of varying depths highlights options to increase capacity on the same footprint.” Biocycle. Accessed at www.deq.state.or.us/lq/pubs/docs/sw/compost/rulemaking/BioCycleSmallerFootprint.pdf on December 11, 2014.
Belton, V., and T. Stewart. 2002. Multiple criteria decision analysis: an integrated approach. Norwell, MA: Kluwer Academic Publishers.
Chadderton, C., C. M. Foran, G. Rodriguez, D. S. Gilbert, S. D. Cosper, and I. Linkov. 2015. “Decision Support for Selection of Food Waste Technologies at Military Installations.” Journal of Cleaner Production (currently in review).
Dobles, A., B. Lai, F. Putri, J. Mathesius, and T. Zhang. 2014. “Composting Fort Hood,” student report. ILLINOIS COMPOST2g.
Fey, C., C. Chadderton, G. Rodriguez, D. Gilbert, A. Urban, and C. M. Foran. 2016. Organic Waste Diversion Guidance for US Army Installations. Vicksburg (MS): US Army Corps of Engineers Engineer Research and Development Center (currently in review).
Foster, D. 2011. “Army Identifies Net Zero Pilot Installations” (US Department of Defense Release No. 319-11). Washington DC: US Department of Defense. Accessed at http://archive.defense.gov/Releases/Release.aspx?ReleaseID=14420 on October 6, 2015.
Kahneman, D. 2011. Thinking, Fast and Slow. Farrar, Straus, and Giroux, ISBN 978-0374275631.
Lopez, C. T. 2012. “Installations making progress toward ‘Net Zero’ by 2020.” Chicago, IL: Army News Service. Accessed at www.army.mil/article/72241/Installations_making_progress_toward__Net_Zero__by_2020 on October 6, 2015.
Oswald, M. E. and S. Grosjean. 2004. “Confirmation Bias.” In Pohl, Rüdiger F. Cognitive Illusions: A Handbook on Fallacies and Biases in Thinking, Judgement and Memory. Hove, UK: Psychology Press. pp. 79–96. ISBN 978-1-84169-351-4. OCLC 55124398.
