As a senior designer at a civil engineering firm, I have been challenged with many stormwater management designs for new facilities and retrofitting of existing facilities with current best management practices. To provide consistent results to local and state agencies during the review process, I have organized an analytic process using free software and standard mathematical calculations to assess the effect of a potential dam failure on the downstream channel. The sudden release of stored runoff can have significant impacts on the community, including damage to property, roads, and even potential loss of life should someone be in the danger reach when a breach wave is released downstream. The analysis process is intended for the most common stormwater management facilities—small pond designs receiving less than 1 square mile, or 640 acres, of drainage. Often these facilities have minimal safety concerns as compared to lakes and reservoirs; however, every dam design must evaluate the possibility of a dam failure. According to the National Inventory of Dams, there are more than 87,000 registered dams across the United States. Other studies such as the National Land Cover Database (NLCD) suggest a total of more than 8 million natural and manmade impoundments.
For local municipalities to meet the requirements of the federal and state government agencies for water quality and to better control stormwater runoff, many are retrofitting drainage basins with improved structural stormwater management practices. This includes improving existing facility construction to current treatment criteria or the construction of a new facility to treat stormwater to the maximum extent possible. In certain circumstances, ponds built in the 1980s and 1990s are in excellent condition but do not provide the best management practices for today’s stormwater management criteria. Designed to reduce peak runoff and leave little impact to water quality, these facilities were typically built as part of development projects. Many ponds were constructed with no downstream concerns. With the construction of additional roads, homes, and businesses within the potential breach wave, these communities may increase the danger classification for the pond. When a facility is constructed within a drainage basin without any current attenuation systems, there may be a dramatic reduction of peak runoff during design storms; however, the design may have to be reduced to limit the potential damage resulting from a dam failure.
Many different studies, technical reports, and software have been developed for all aspects of stormwater management, several of which specifically discuss dam breaches. Without detailed failure information, a dam break analysis is largely based on assumptions and scenarios. An analysis should be conservative in nature, but not encompass unrealistic situations. Engineers and review authorities must use professional judgment to adequately protect the public, yet not become overbearing to stormwater management design.
Designers are tasked with following each jurisdiction’s requirements to meet the minimum criteria for stormwater management facility design and construction. With this in mind, it is difficult to prepare a “one and done” design process for analyzing dam failures. However, the approach described in this article provides basic guidance and can be adjusted to meet your review authority’s approval standards.
General Overview of Analysis
Long before preparing a formal dam breach analysis, a designer must look at the ramifications of impounding water within a watershed. Engineers should examine the potential downstream impacts and danger analysis points prior to getting deep into the intricacies of design. This is the pre-design phase. Once the best point of discharge is determined, the design moves into the design phase where the watershed hydrology and facility hydraulics are determined. This is the meat and potatoes section of most engineers’ work. Following the design phase, the designer moves to the analysis phase. Depending on the results of the failure analysis, the designer may be forced to make changes to the facility design to reduce downstream concerns. The fourth and final phase of dam break consideration is the post-construction phase, which begins upon construction of the dam and continues throughout the life of the facility (Figure 1).
It is important for designers, engineers, approval authorities, and property owners to understand the importance of dam failure analysis and how it cannot be successful when it becomes an afterthought. The perception of a dam break should not be based on one opinion of how unlikely a failure would be to occur but on how much damage could occur if the unthinkable happened.
Design Aspects
Incorporating Standard Design Software. Throughout the United States there are thousands of review authorities. Many accept commercial design software, while nearly all accept free standard software such as TR-20, TR-55, and HY-8. TR-55 and TR-20 are products of the USDA Natural Resources Conservation Service (NRCS) currently available in Windows format and known as WinTR-20 and WinTR-55. TR-55 is a tool for modeling urban watersheds that calculates storm runoff volumes and peak rates of discharge. TR-20 is a watershed runoff and routing model, using rainfall data to generate hydrographs by passing flow-through tributaries, reservoirs (areas of stored runoff), and structures. The HY-8 is provided by the US Department of Transportation Federal Highway Administration (FHWA) and is a hydraulic analysis program for evaluating the efficiency of culverts.
Compatibility between software systems is not necessarily direct, but can they be utilized in combination to assist in accurately modeling drainage systems. TR-55 is used to generate time of concentration (Tc) and cumulative surface runoff curve number (CN) data used to input drainage areas in the TR-20 platform. HY-8’s analysis of a culvert, in combination with headwater storage volume calculations upstream of the pipe, can be entered into TR-20 as a structure to determine reservoir storage elevation and discharge rate for breach analysis.
Using a combination of accepted software platforms provides the engineer with the opportunity to accurately and consistently model the breach and non-breach conditions. The review authority has the ability to recreate design information and verify that it is acceptable within the regulations.
Factors of Safety. Engineering and stormwater management design is conservative by nature. While we attempt to predict worst-case scenarios, it is impossible to accurately model all storm and runoff conditions. The typical length of service for a small pond averages 25–50 years. When a facility is nearing the end of its life expectancy, it is likely to be considered for retrofit and upgrade to current standards, allowing it to sustain another 25–50 years. It is unrealistic to design every facility to handle a 200-year or even 500-year storm event, because the likelihood of these events occurring while these facilities are in good working order is minimal.
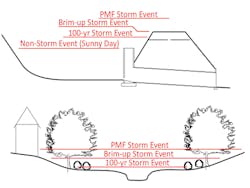
It is important to remember that there is always the possibility for a catastrophic dam failure causing damage to the downstream ecosystem, drainage structures, personal property, and even the possibility of losing human lives. Several sources suggest that overtopping of the dam is the most common cause for dam failure because facilities are rarely designed to safely convey the probable maximum flood (PMF), followed by seepage or piping failures. Other factors including differential settlement, ice, structural damage, and vandalism or sabotage can lead to failure, while in some cases, the failure cause cannot be determined. As with designing a facility to withstand any hydraulic condition, it is impossible to analyze every failure condition. Common analysis conditions include sunny day, non-storm-event failure, where water detained in a facility is suddenly released downstream, and storm event failures including the 100-year storm, a brim-up, and the PMF events.
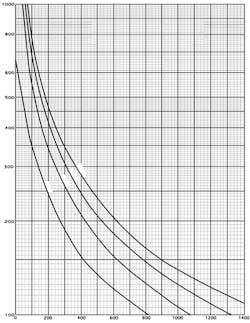
Considering reasonable worst-case scenario conditions throughout the analysis provides the engineer with a level of confidence that the expectations within the report would stand up in a court of law should a dam fail and the engineer be held responsible for not anticipating the level of danger associated with a dam. A tool published by Franklin F. Snyder in 1964, “Hydrology of Spillway Design,” can help determine the danger reach length. The nomograph uses dam height and valley width to determine approximately how fardownstream until the breach wave would be at 1 foot in depth or less (Figure 2). This distance can then be multiplied by the pond’s storage volume at the time of the failure.
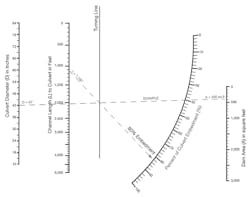
I have developed a nomograph to estimate the depth a culvert may embed, subsequently clogging and reducing its efficiency (Figure 3). As a dam fails, the flow becomes sediment-laden with the embankment soil. Depending on the velocity of the breach wave, debris can also be transported by the wave to points downstream. This chart uses the culvert diameter and cross-sectional area of a dam along with the distance downstream of the point of failure to estimate a percentage of embedment. This factor of safety can then be applied to the breach condition structures, assuming that during the dam failure the culvert would not pass the same flow as it would during normal storm events. This chart has not been scientifically proven, and many factors affect the clogging of culverts. The intent is to provide a user with a consistent start point. Once the start point has been established, designers can apply their own judgment to determine if their situation warrants the described embedment.
Ultimately, adjusting factors of safety falls to the engineers. They must use their experience, knowledge, and interpretation of the calculations to evaluate the results for realistic considerations. This interpretation also must be agreed upon by the review authority so as not to allow a dam to be approved for a classification less than the anticipated danger.
Anatomy of the Analysis
Pre-Design Phase. Preparing a formal dam breach analysis begins at the same time as the facility design commences. An engineer immediately considers the design criteria and volume of runoff to be stored within the facility in order to size the footprint of the pond and determine the types of treatment provided. Will water quality be provided through a sand filter or bioretention filter, or possibly through a wet pool or extended detention? The outlet structure is also determined early in the design with or without an emergency spillway.
The designer must also understand what the breach criteria will be (Figure 4). Will the analysis be subjected to a breach during a sunny day, non-storm event failure, or at the peak of a design event like the 100-year storm or a brim-up storm condition?
Before beginning any detailed design and computations, an engineer should consider how the intended design will lend itself to a dam breach analysis. Depending on components of the design, such as using the embankment as a road, the facility may be required to meet additional requirements. Ponds without emergency or token spillways may be required to consider an overtopping failure versus a piping failure. Designers should also evaluate a concept breach discharge on the watercourse downstream, including the distance and potential impact to roads, houses, and pedestrians, along with the condition of downstream structures. It is better to understand the potential impact and make adjustments early in the design process instead of trying to prepare an analysis to meet the expectations of “what you thought it would be.”
Experienced designers and engineers can often tackle the pre-design phase in a short period of time ranging from minutes to a few hours. It is important to remember the ramifications of the dam failure analysis at this point in the project’s progress so as not to cause a hardship when a project is forced to engage in discussions of a higher dam hazard classification than anticipated.
Design Phase. This phase begins with a present condition analysis using TR-55 to determine runoff characteristics prior to site and stormwater management improvements. If a downstream property or culvert is specifically to be analyzed during a storm event breach condition, the designer should incorporate the runoff hydrology adding additional design points in the overall design routing. Post-development hydrology will also be prepared along with sizing and analyzing the stormwater management facility, and ultimately ending with routing the design using TR-20.
This is the primary essence of most engineers’ work, where they must prepare the design to meet the treatment requirements set forth by laws and ordinances, and then develop detailed and accurate plans for use during construction. Generally the dam breach analysis is not a part of these plans, yet determines the safety classification of the dam.
Analysis Phase. Once the design is finished and all design storage volumes and discharge rates have been determined, the analysis phase may begin by calculating breach rates and release volumes. In general, the requirements of your approval authority must be met; however, for the purpose of this article we will focus on two breach conditions: the sunny day, non-storm-event failure and a brim-up storm event with and without failure conditions.
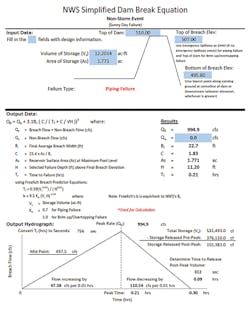
The sunny day, non-storm-event failure assumes that the primary outlet structure is blocked and unable to release any water from the facility. The breach volume can then be evaluated using either the emergency spillway, 100-year design water surface, or top-of-dam elevation. The commonly accepted National Weather Service (NWS) Simplified Dam Break equation using the Froelich Breach Predictor equations for timing results in a breach discharge rate. Using the peak discharge rate, volume of storage, and time to peak calculations, a designer can derive a triangular hydrograph of the breach discharge. The calculations from the NWS Simplified Dam Break Equation spreadsheet (Figure 5) can be used to input a hydrograph in TR-20. This hydrograph can then be applied to a structure or stream cross section during the routing. If there are multiple points of analysis downstream, applying the hydrograph to the first analysis point will result in the breach discharge being attenuated and passed through the remainder of the routing.
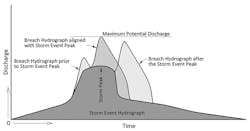
To analyze the brim-up storm event, the designer must first determine what depth of runoff will cause the facility to store runoff to the top of dam elevation. This is typically a trial-and-error process resulting in running the TR-20 multiple times until the routing is optimized. Once the storm event has been determined, the analysis can be used to summarize a brim-up storm in non-breach condition. This provides a baseline so that when the breach condition is evaluated, the engineer can determine the increase resulting from the surplus of water passing downstream. Next the designer will determine the breach discharge using the NWS Simplified Dam Break equation. In cases where there is a tailwater depth downstream of the facility greater than the bottom of the sunny day breach elevation, a designer can use the tailwater elevation as the bottom of breach elevation. This is because the downstream water surface constricts the amount of water that can be discharged. To add a factor of safety to the analysis for the downstream culverts that will receive dam failure runoff, the designer should revise the HY-8 analysis of these culverts to consider embedment. The TR-20 structures should be updated to incorporate this clogging and subsequent reduction of flow through the pipe. As an engineer would do in the non-storm-event condition, the next step to analyze the brim-up storm with a failure condition would be to input the breach hydrograph into TR-20, then adjust the start time for the breach so the peak will coincide with the non-breach condition brim-up analysis peak. By aligning these two condition peaks, the results provide the greatest discharge rate and highest depth of water at the analysis point. Should the breach occur on either side of the storm peak, the breach condition would subsequently be lower (Figure 6).
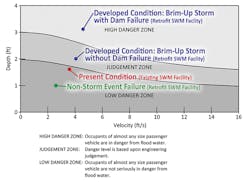
After the routing is complete, the engineer has several options to analyze the resulting data. Initially, the analysis results can be plotted on the flood danger charts from the ACER Technical Memorandum No. 11, “Downstream Hazard Classification Guidelines” (Trieste 1988) to determine the flood danger zone for cars, houses, or people. For velocity, use the Continuity Equation (Q=AV). The report results provide a discharge rate (Q) and a depth of flow, so the area (A) of flow over the road or against a house can be easily determined. The routing discharge rate can also be used to apply a Manning’s channel section at intermittent points along the watercourse. Refer to Table 5-6 in Open-Channel Hydraulics by Ven Te Chow (2009) for baseline roughness coefficients and consider increasing them to account for the additional sediment and debris carried downstream during a dam failure. Depending on the results, the design may require adjustments to maintain the intended hazard classification. Revising design aspects of the facility will require the designer to reevaluate the dam breach analysis phase of the project.
Post-Construction Phase. Beginning once the dam is constructed and as the facility begins to function, the project transfers to a post-construction phase and will continue throughout the life of the facility. The initial first step in this phase is a topographic survey and as-built analysis of the facility to verify that it has been constructed in accordance with the plans. If there is a discrepancy between the design and as-built, the engineer may be required to reevaluate the dam breach analysis. When there is an as-built increase in storage, there will also be an increase in the breach discharge should the dam fail. While in many cases this increase, when minimal, would have little effect on the dam break results, any change could impact a marginal hazard classification.
Through the years after construction, regular inspections should recognize changes in the facility’s ability to safely convey large storms. Damage to the dam, erosion, settling, and sediment could change the pond’s capacity and result in the facility’s inability to safely convey storm runoff, thus making it more susceptible to overtopping. Oversight authorities should consider reevaluating dam breach characteristics periodically to ensure that there has been no change to the downstream hazards.
Another aspect of the post-construction phase is the construction of new infrastructure or communities downstream of the dam. Designs for this typically consider a design storm such as a 100-year storm event to determine a floodplain. One must recognize that if the pond has been considered a part of the floodplain analysis, a failure of the dam could result in a breach wave greater than the floodplain depth should it occur during a 100-year storm event. This may leave these structures or houses vulnerable to damage if they were not part of the initial dam breach analysis. Consequently, any new construction within the danger reach distance analysis should be required to reevaluate the dam failure of the upstream facility.
Hazard Classification
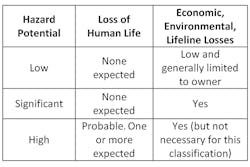
Once all of the analysis is complete, the project turns to the hazard classification to establish the danger rating of a dam. Hazard classifications are typically rated on three levels ranging from low to high. The National Inventory of Dams and the Federal Emergency Management Agency, like many jurisdictions, use low-, significant-, and high-hazard potential for dam ratings. Some jurisdictions use numeric or alphabetic ratings (Figure 7).
Final determination of the hazard classification typically is handed down from the review authority approving the construction of the dam based on the results of the dam breach analysis. Often low-hazard or high-hazard classifications are very easy to determine. Determining the marginal cases and significant-hazard dams is more difficult and becomes a judgment call. Engineering judgment and experience must be used in coordination with experience and project-specific factors. These circumstances may require additional analysis of key points downstream to truly determine what a reasonable hazard classification may be. Unfortunately, there is no one way or one right answer to determine marginal hazard classifications. The ACER Technical Memorandum No. 11, issued by the US Department of the Interior, Bureau of Reclamation in 1988 provides classification guidelines along with flood danger relationship charts for houses, mobile homes, cars, and pedestrians. These charts are an excellent resource for comparing breach and non-breach conditions.
Every project is unique, and no matter how much we want to believe one stormwater management pond is like every other stormwater management pond, each offers its distinct benefits and concerns. Some will offer flood protection and channel protection, but the vast volume of storage may actually endanger more lives downstream than allowing a slightly higher release rate during larger storms. Other circumstances warrant the implementation of a high-hazard classification because of the water supply, recreational, and flood protection benefits of a large pond.
Once a significant-hazard or high-hazard designation has been determined, the analysis should be revised to include analysis of the PMF storm event and subsequent simultaneous failure. These designations should establish and implement an emergency action plan (EAP). An EAP is a written document that facilitates and organizes actions during flood emergencies and potential dam failure situations. FEMA’s Federal Guidelines for Emergency Action Planning for Dams (FEMA 2004) provides a substantial amount of guidance for preparing and executing emergency action plans including checklists and example formats. While each jurisdiction may have different requirements, this document, last updated in 2013, may be a great starting point for new EAPs or updates to existing ones.
Analysis Example
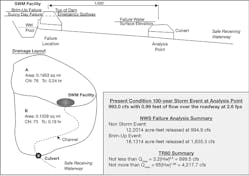
Overview. This design study considers a retrofit of an existing stormwater management facility located 1,620 channel feet upstream of a roadway culvert. A safe receiving waterway is situated downstream of the roadway culvert. The drainage area to the facility is 125 acres. There is an additional 85 acres, a total 210 acres, to the culvert entrance.
The study compares the retrofit condition non-storm-event (sunny day) failure to the present condition, pre-retrofit 100-year storm event condition. It also compares a brim-up storm to a brim-up storm with dam failure (Figure 8).
Summary. During the pre-design phase, the present condition 100-year storm hydraulics were determined using TR-20. An approximate danger reach length based upon the valley flood routing method showed an estimated danger reach of the retrofit facility to be about 5,300 feet, meaning all points of concern should be considered within this range.
After the facility hydraulics were determined prior to finalizing the design, dam failures were considered for the non-storm event and the brim-up storm event. For the brim-up condition, both with and without failure scenarios were considered.
Using the National Weather Service Simplified Dam Break equation along with the Froelich Breach Predictor equations, a hydrograph for releasing the breach volume was determined. Embedment of the downstream culvert was used to add a factor of safety to the breach condition analysis. TR-20 was used to study the effect of the discharge at the roadway culvert. For the brim-up condition, the breach hydrograph was aligned with the roadway culvert peak, providing the highest possible water surface elevation at the analysis point.
The final aspect of the design investigation plots the water surface elevations and velocities on the Flood Depth-Velocity Flood Danger Relationship for Passenger Vehicles chart (Figure 9).
Conclusion. For jurisdictions that base the danger classification of a dam on the non-storm-event sunny day failure, the facility would be a low-hazard dam. It should be noted that the retrofit sunny day failure is less than the present condition 100-year storm event. If the review authority considered the brim-up condition, the dam may be considered a significant- or high-danger dam because a dam failure during the brim-up storm event could be a risk for the public should a vehicle be on the roadway at the time of failure.
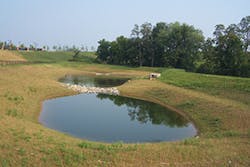
Stormwater management pond in Urbana, MD. The facility was constructed as part of a subdivision project and provides water-quality and -quantity management for commercial runoff.
Conclusion
In coordination with state and federal regulations, stormwater management principles and practices continue to evolve. This evolution includes advanced treatment methods for improving water quality along with the goal of reducing runoff during smaller storm events. This causes facilities to increase storage volumes and detention times, which may increase the potential impacts of a catastrophic dam failure. An increased focus on dam failure and the potential impacts to the areas downstream requires everyone involved in the design and construction of a stormwater management impoundment to consider the possibility that the dam could fail at some point in the facility’s lifetime.
No dam breach assessment will ever be perfect. One would hope that the combination of analysis and engineering judgment would provide the downstream region with a realistic expectation of the damage that could result from a dam failure. It is unrealistic to believe that one analysis would provide an exact prediction of a failure event.
With a better understanding of dam failures, additional case study information, and a compassion for both human life and environmental impacts, I believe we will only get better at predicting and preventing dam failures. Nevertheless, nature is powerful and relentless. Dams do fail and will continue to do so. No design is perfect, and no matter how unlikely a dam failure is, it is impossible to design and construct small pond facilities to safely convey all storm event runoff safely. Using a consistent, repeatable, and reliable sequence of analysis for dam failures is important to a jurisdiction’s regular review and approval process. My hope is that the tools and concepts described in this article will benefit you in your next project.
References
Chow, V. T. 2009. Open-Channel Hydraulics. Blackburn Press.
FEMA. 2004. Federal Guidelines for Emergency Action Planning for Dams. (FEMA Publication P-64). Federal Emergency Management Agency.
Snyder, F. F. 1964. Hydrology of Spillway Design. Journal of the Hydraulics Division, Vol. 90, No. 3, May/June 1964, pp. 239-259.
Trieste, D. J. 1988. Downstream Hazard Classification Guidelines (ACER Technical Memorandum No. 11). US Department of the Interior.
* Figures 3 and 5 are available for download at www.dabldo.com.


