My previous article discussed the fallacy of requiring the containment of 3,600 ft.3/ac. (250 m3/ha) to develop sediment basins/traps. While effectiveness of these structures will be 100% when they retain water, it is not realistic to expect this amount of runoff is representative of real-world conditions. This article explores alternatives that address this problem with the intent of developing effective “detention” structures that can be implemented on construction sites.
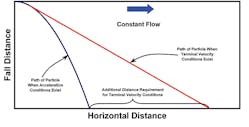
Figure 1 illustrates what happens to suspended particles in flowing waters when they experience accelerated and terminal velocity conditions. When properly designed, most sediment basins/traps are able to capture large-diameter particles (i.e., large sands, pebbles, small rocks) as they accelerate downward through a water column. However, the same cannot be said for containment systems to capture small suspended particles (e.g., small sands, silts, clays) that fall at a terminal velocity.
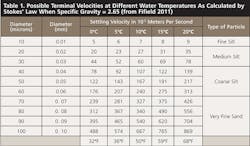
The capture of larger-diameter particles by accelerated conditions can be described by Newtonian physics. Unfortunately, Newtonian physics does not describe how smaller particles fall through a fluid with a terminal velocity. Usually, we rely upon Stokes’ Law with all its assumptions and flaws to describe this motion. (See Table 1.)
The Importance of Discharges From a Containment System
When discharges of contained waters are essentially nonexistent, effectiveness of a sediment basin/trap will be high, because optimum conditions exist for sedimentation (Minton 2013). However, as discharges from containment systems increase, the effectiveness decreases. It is for this reason that flow rates of contained waters discharging from a system (Qout) are the most important parameter to consider for designing an effective sediment basin/trap.
When contain waters take two or more days to drain, a high effectiveness usually exists to capture suspended solids. An exception may be for very small suspended clay colloidal particles that are impacted by Brownian forces. Conversely, when runoff waters drain from a sediment basin/trap in a short time (e.g., two to three hours) the system is likely to have a low effectiveness to capture suspended solids.
What happens when the amount of runoff exceeds a containment volume? When this occurs, a detention structure becomes a “flow-through” system, and discharges (Qout) become equal to inflow runoff rates (Qin).
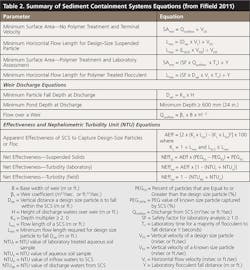
The dynamics of how a flow-through system captures suspended particles during flood flow conditions are complex. However, by incorporating the following assumptions to simplify the process, Fifield (2011) developed a set of equations for assessing how a sediment basin/trap might capture suspended particles during “design” flood discharge conditions.
- The predictive capture of small suspended particles happens where laminar flow conditions exist.
- A constant internal flow velocity exists within the containment structure.
- Water temperature remains constant throughout the water column.
These equations and their associated variables are summarized in Table 2.
Example Problem
The best way to illustrate use of the sediment basin equations is to emulate detention basin design, namely evaluate what happens in a hypothetical containment system when design flood discharge conditions occur. However, instead of using 100-year flood flows, we will confine our design discharges to what happens for a more common design frequency (e.g., 2-year, 24-hour) rainfall event.
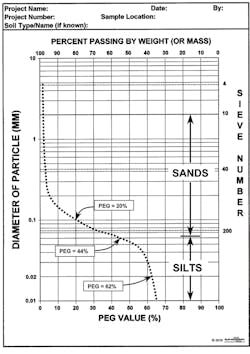
If a sediment basin/trap is to capture suspended particles, it becomes important to know the distribution of suspended particles that might be suspended with incoming runoff waters. This requires understand the composition of upstream contributing soils, which can be estimated by completing a sieve analysis of the contributing soils and generating a PEG drawing.
Figure 2 provides a size distribution of incoming suspended particles as illustrated on a PEG drawing. What is provided is a picture for designers and reviewers to know more about contributing soils such as:
- The percentage of Particles with diameters Equal to or Greater than a design size particle. For example, a 60-micron (i.e., 0.06-mm) size particle is about 44% and is expressed as PEG60 = 44%
- More than 50% of the soils are silts and clays, which indicates the containment system needs to be properly designed to capture small suspended particles during flood discharge conditions.
- For a commonly specified “design-size” particle of 20 microns, the PEG20 = 62%.
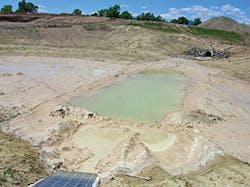
Consider changing a detention pond into a temporary hypothetical sediment basin (Figure 3). Assume the hypothetical sediment basin is created by installing a rock barrier in front of a discharge pipe that simulates a sharp-crested weir having a crested width of 6 feet (1.8 m).
For this exercise, use the information found in Table 3 and assume Figure 2 represents a particle distribution of contributing upstream soils. Since the configuration of most sediment basins vary, the internal flow velocities will also vary. Thus, also assume the internal flow velocity in Table 3 is representing an average internal flow value for the structure.
Capturing Design-Size Particles. Our task is to assess the effectiveness of this hypothetical sediment basin to capture design-size particles while flood discharges from the system occur. For this exercise, we will evaluate the effectiveness of the containment system to capture 20-micron-size particles during a discharge event of 8.6 ft.3/sec. (244 liters/sec.).
Minimum Surface Area. A minimum surface area of our hypothetical sediment basin/trap to capture 20-micron design-size particles can be found using the following equation from Table 2:
SAmin = Qout ÷ VDS
Equation 1
Since flow-through conditions exist, we know that Qin = Qout = 8.6 ft.3/sec. From Table 1, a 20-micron design-size particle at 50°F (10°C) has a terminal velocity of V20 = 27 x 10-5 m/sec = 89 x 10-5 ft./sec. Substituting these values into Equation 1 yields:
SAmin = 8. 6 ÷ (89 x 10-5)
= 9,663 ft.2 (898 m2)
Notice that Equation 1 indicates capturing smaller suspended particles during design discharge conditions require a corresponding increase in surface area. Likewise, capturing larger-diameter sediments can be accomplished with smaller surface areas. For example, capturing 10-micron-size particles may require a sediment basin/trap to have a surface area of about 37,445 ft.2 (3,478 m2), whereas trapping 30-micron-size particles may only need a surface area of 4,370 ft.2 (406 m2).
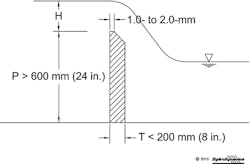
Minimum Fall Distance. As illustrated in Figure 1, when contained waters flow toward the discharge weir, nearly all the suspended particles will fall vertically while moving horizontally. Since the moving waters will discharge over a sharp-crested weir, design size suspended particles need to fall at least the depth of flow (H) over the barrier (Figure 4). This depth can be calculated using Equation 2:
Qout = β1 x B x H1. 5
Equation 2
When discharge waters over a sharp-crested weir have depths less than 12 inches (300 mm), the weir coefficient (β1) will be about 3.4. Thus, applying known information to Equation 2 yields:
8.6 = 3. 4 x 6 x H1. 5
H = 0.56 ft. (0.17 m)
= 6.7 in. (170 mm)
Unfortunately, only in an idealized world can it be assumed that every 20-micron design-size particle will fall exactly 6.7 inches during a discharge of 8.6 ft.3/sec. In order to compensate for real-world conditions, it is necessary to incorporate a safety factor (KH) that ensures adequate fall distances exists to capture design-size particles behind the barrier. Assuming a safety factor of 2.0, an estimated minimum fall distance for the 20-micron particles can be calculated by Equation 3.
Dver = KH x H
= 2.0 x 6.7 = 13.4 in.
= 1.1 ft. (0. 33 m)
Equation 3
Minimum Horizontal Flow Distance. As sediment-laden waters flow through our hypothetical sediment basin, it is important to remember that while suspended particles are falling vertically, they are also traveling horizontally. The unknown is how far 20-micron-design size particles need to travel horizontally in order to fall 13.4 inches (340 mm) when an internal flow velocity of 0.46 ft./sec (0.14 m/sec) exists. This is determined by Equation 4:
Lmin = (Dver x VL) ÷ VDS
= (1.1 x 0.46) ÷ (89 x 10-5)ft/sec.
= 569 ft. (173 m)
Equation 4
Now we have a problem! The internal flow distance for our hypothetical sediment basin is only 170 feet. Hence, a sufficient horizontal distance does not exist to capture all 20-micron particles. Thus, during flood discharges of 8.6 ft.3/sec, our hypothetical sediment containment system will not adequate to capture all the design sized particles.
A horizontal flow length of 170 feet is still sufficient to trap larger diameter particles that fall 13.4 inches. These larger suspended particles can be estimated by calculating a terminal velocity (VKS) using Equation 5 and comparing the results to values found in Table 1.
Lmin = (LSCS x VKS) ÷ VDS
569 = (170 x VKS) ÷ (89 x 10-5)
VKS = 298 x 10-5 ft/sec
= 90 x 10-5 m/sec
Equation 5
At a water temperature of 50°F, from Table 1 we find that suspended 36-micron-size particles will have a terminal velocity of about 90 x 10-5 m/sec. From Figure 3, we also find the value of PEG36 is approximately 58%.
Effectiveness of a Sediment Basin During Flood Discharge Conditions. Now, sufficient information exists to calculate an effectiveness of our hypothetical sediment basing to capture a 20-micron design-size particles while flood discharges of 8.6 ft.3/sec occur. This is accomplished by using Equation 6.
AEff = [2 x (KL x LSCS) – (KL x LSCS)2] x 100
Equation 6
where
KL = 1 ÷ Lmin and LSCS ≤ Lmin
For this situation,
KL = 1 ÷ 569
= 1.76 x 10⁻³ ft.-1
which when applied to Equation 6 yields:
AEff20 = [2 x (1.76 x 10-3 x 170) – (1.76 x 10-3 x 170)2] x 100
= 50.8%
Thus, our hypothetical sediment basin will be about 51% effective in capturing 20-micron design-size suspended particles when discharges of 8.6 ft.3/sec. occur.
It is important to note that as discharges from the containment system become smaller, a greater percentage of design size particles will be captured. Likewise, larger flood discharges will result in less capture of design-size particles.
Calculating an AEff20 value only assesses how effective our hypothetical sediment basin is in capturing design-size particles for flood discharges. Of greater interest is determining how effective the system will be in removing all suspended solids during the same discharge conditions. This is completed by using Equation 7.
NEffSS = AEffDS x (PEGDS– PEGKS) + PEGKS
Equation 7
Previously, it was found that
PEGDS = PEG20 = 62%, and PEGKS = PEG36 = 58%
which when applied to Equation 7 yields:
NEffSS = 0.508 x (62% -58%) + 58%
= 60%
Thus, our hypothetical sediment basin may be about 60% effective in trapping all suspended solids entering the containment system when a design flood discharge of 8.6 ft.3/sec exists. When discharges become smaller, the sediment basin will become more effective in capturing suspended soils. Conversely, when discharges are greater, net effectiveness will become smaller. It is for these reasons that discharge from sediment basins/traps is a critical parameter in determining the effectiveness of a system to capture suspended solids.
Using Polymers
How can the effectiveness of sediment basin/trap be increased? One method is to install baffles to increase the internal flow distance particles have to traverse. Another is to add polymers to the inflow waters.
Introducing polymers into runoff waters can result in the flocculation of colloids to create larger particles known as flocs. Since flocs can have a large mass, high terminal velocities (and possibly accelerated conditions) can develop that result in an effective removal of small diameter particles and colloids from runoff waters. However, the use of polymers for sediment control must be done with professionalism and accountability.
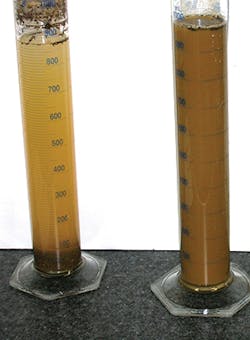
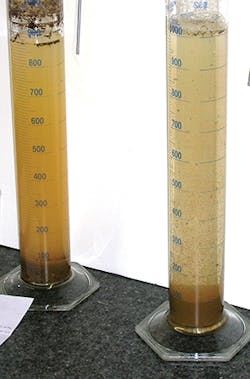
As an example on using the polymer equations in Table 2, assume a soil sample was collected from upstream disturbed lands to the sediment basin and a column test completed as illustrated in Figure 5 and Figure 6.
The left graduated cylinder illustrates what happens after 92 hours. In Figure 5, the right cylinder illustrates a new soil mixture, which may be representative of sediment-laden inflows (NTUo = 5,300) to the sediment basin. In Figure 6, the right cylinder illustrates what occurs 135 seconds after adding a polymer that creates a floc that falls about 13 inches (330 mm). Table 4 summarizes the test results.
The minimum surface area for the sediment basin can be calculated by Equation 8:
SAmin = (SF x Qoutflow x TY) ÷ Y
Equation 8
It is likely that turbulence and many unknown conditions will exist for the containment system as sediment-laden waters enter the basin. Thus, a safety factor needs to be introduced, which we assume will be 3.0.
Thus,
SAmin = (3.0 x 8.6 x 135) ÷ (13 ÷ 12)
= 3,215 ft.2 (299 m2)
The small minimum surface area is expected since the “design-size” particle is now represented by larger floc material.
The minimum horizontal distance sediment laden particles treated with a polymer are to travel as they fall 13.4 in. (340 mm) is calculated by Equation 9.
Lmin = (SF x Dver x VL x TY) ÷ Y
= (3 x 1.1 x 0.46 x 135) ÷ (13 ÷ 12)
= 189 ft. (58 m)
Equation 9
If Lmin < LSCS then AEff would be about 100%. In this case, the minimum flow distance is greater than 170 feet, which indicates the need to calculate the effectiveness of this sediment basin to capture floc material when discharges of 8.6 ft.3/sec occur. Thus,
AEff = [2 x (KL x LSCS) – (KL x LSCS)2] x 100
= [2 x (1 ÷ 189 x 170) – (1 ÷ 189 x 170)2] x 100
= 98.8%
Now, all that is needed is to determine the net effectiveness this containment system during discharge conditions, which requires using turbidity readings. Since treated waters are being removed near the surface, NTU values at a depth of 4 inches (100 mm) will be used. Thus,
NTUo = 6,300, and
NTUf = 160
which when applied to Equation 10 will yield the following:
NEfftur = AEff x [1 – (NTUf ÷ NTUo)]
= 0.988 x [1 – 160 ÷ 5,300]
= 95.8%
Equation 10
Yes, many will view the above exercise as idealistic. However, it demonstrates that sediment-laden waters entering a containment system can be treated with polymers that significantly increase the effectiveness when a thoughtful, practical, and accountable design of a sediment basin/trap occurs.
What Have We Learned?
A properly designed sediment basin/trap is the most effective structural method to remove sediment found in runoff waters emanating from a construction site. Runoff waters that are retained or have long detention times will likely have a high effectiveness to capture suspended solids. However, once contained waters discharge from a sediment basin/trap, the system’s effectiveness will become smaller. Thus, designers and reviewers should always conduct an effectiveness assessment for design flood discharge conditions to assess potential risk problems.
Our exercise on a hypothetical sediment basin demonstrated the complexity of designing an effective containment system during design flood discharge conditions. Some of those design consideration for an effective system includes the following.
- Discharge rate of contained waters from a sediment basin/trap is the most important parameter to assess when designing an effective sediment containment system.
- Containment volume will usually be dictated by a structural configuration. However, if a minimum containment volume criterion exists, it should always be based upon runoff from local bare-ground soils caused by a design (e.g., two-year, 24-hour) rainfall event.
- A minimum surface area of a sediment basin/trap is inversely proportional to the terminal velocity of a design-size particle and directly proportional todischarges from the system.
- When flood discharge conditions exist, maximum effectiveness is dependent upon long internal flow paths for suspended particles to travel within the containment system.
- The net effectiveness of sediment basins/traps should always be evaluated for design discharge conditions.
- Inserting polymers into inflow runoff waters provides an effective method for a sediment basin/trap to capture suspended particles during design flood discharge conditions.
References
Fifield, Jerald S. 2011. Designing and Reviewing Effective Sediment and Erosion Control Plans. Third Edition. Forester Media, Santa Barbara, CA.
Minton, Gary. 2013. “The Principles of Gravity Separation. Part 1. Sedimentation.” September/October 2013 Stormwater.
